
Why the longest yield curve inversion did not cause a recession
The yield curve inverted before every US recession since 1969. Then the longest inversion on record ended, and no recession came.
On September 5, 2024, the yield on the two-year US Treasury note dropped below the ten-year note for the first time in more than two years. The gap between those two rates, known as the yield curve, had been inverted since July 2022, longer than any previous inversion on record. For more than fifty years, every time the yield curve had inverted, a recession followed. Two years later, no recession has come.
The pattern was first documented by Campbell Harvey, a finance professor at Duke University, in his 1986 doctoral dissertation at the University of Chicago. He showed that the slope of the yield curve predicted economic growth better than any other single indicator. Since then the curve has inverted five more times, and each time a recession followed, until now.
What a yield curve inversion is
The US government borrows money by selling Treasury bonds. Some mature in three months, some in two years, some in ten or thirty. Normally, longer bonds pay a higher interest rate than shorter ones. That makes intuitive sense: if you lend money for a decade instead of a year, you want compensation for the extra uncertainty, the risk that inflation rises or that something goes wrong before you get your money back.
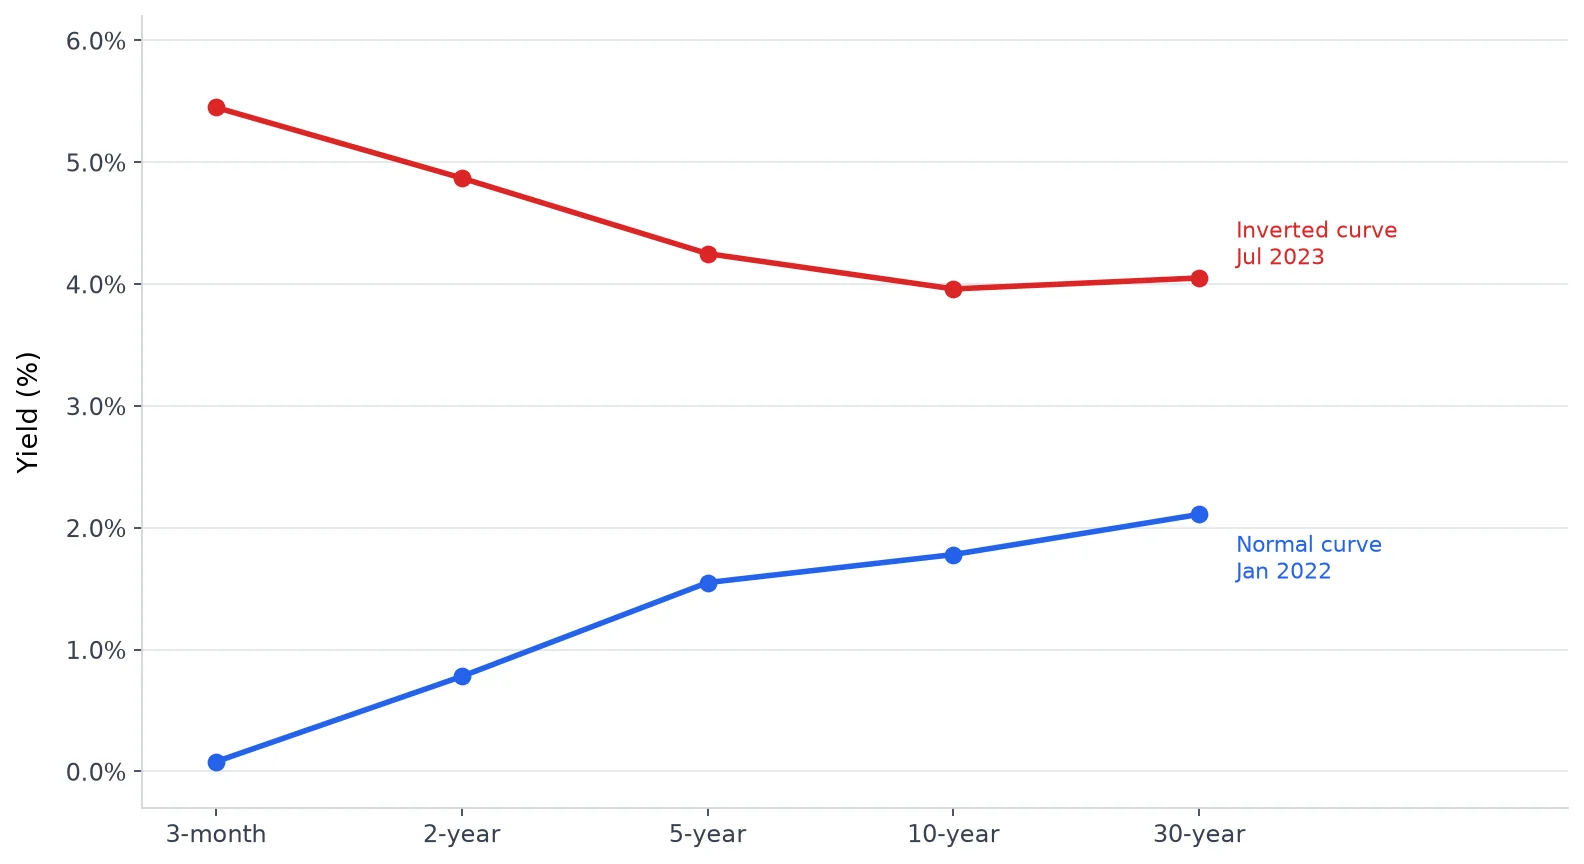
Plot those interest rates on a chart with short-term bonds on the left and long-term bonds on the right, and the line slopes upward. That upward slope is a normal yield curve. An inversion happens when the line flips: short-term bonds start paying more than long-term ones. It means bond investors are so worried about what is coming in the next year or two that they are willing to accept a lower rate on ten-year bonds just to get out of the way.
Why it also helps cause what it predicts
The yield curve does not just forecast recessions. It is part of the mechanism that produces them.
Banks make money in one of the simplest ways in finance: they borrow at short-term rates and lend at long-term rates. A bank takes in deposits and pays the short-term rate, then turns around and makes mortgages and business loans at the long-term rate. The difference is the bank's profit margin. When the yield curve inverts, that margin disappears. A bank paying 5 percent on deposits and earning 4 percent on a new mortgage is losing money on every loan it writes. So it stops writing them.
When banks pull back on lending, businesses cannot borrow to expand or hire, consumers cannot borrow to spend, and the economy slows. This mechanism has fired with remarkable consistency. The curve inverted before the recessions of 1970, 1974, 1980, 1982, 1990, 2001, 2008, and 2020. The only false alarm in more than half a century was a brief inversion in 1998 during the Russian debt crisis, which reversed quickly with no downturn.
How the longest inversion on record played out
Campbell Harvey spent four decades being right. His dissertation predicted the 1990 recession before he had finished defending it. The curve inverted again before 2001, again before 2008, again before 2020. Each time, skeptics said the world had changed. Each time, the recession came anyway.
In July 2022, the curve inverted again, and this time it stayed inverted for 26 months, longer than any previous episode on record. The Fed was raising rates at the fastest pace in decades, from near zero to above 5.25 percent in about sixteen months, trying to kill inflation that had hit 9 percent. The two-year yield sat a full percentage point above the ten-year. A majority of economists expected a recession within a year.
Harvey had to watch his own indicator scream for two straight years while the economy refused to cooperate. Unemployment stayed below 4 percent. Hiring kept going. Consumer spending grew. In interviews during 2023, Harvey said the signal had been distorted by conditions the model had never seen before. He did not abandon the indicator, but he warned that no single measure should be treated as infallible, including his own.
What was different this time
In every previous inversion, the bond market was betting that the economy was about to weaken. Investors bought long-term Treasuries because they expected the Fed to cut rates in response to a slowdown, which pulled long-term yields down while short-term rates stayed high. The inversion was a genuine distress signal.
In 2022, the economy was not weakening. It was overheating. The Fed was raising short-term rates to fight inflation, and the curve inverted not because investors feared a slowdown but because short-term rates were being pushed up faster than long-term rates could follow. The alarm went off, but the fire was in a different room.
The reason it did not spread is that Americans had something no previous generation of rate-hike victims had: pandemic savings. The government had sent out stimulus checks, paused student loans, and expanded unemployment benefits during 2020 and 2021. By the time the Fed started hiking, households were sitting on roughly 2 trillion dollars in extra cash. That money kept people spending even as borrowing got more expensive.
The bank-lending channel, the part of the mechanism where squeezed margins cause banks to stop making loans, also misfired. The biggest borrowers had already locked in low fixed rates during the pandemic years. A homeowner paying 3 percent on a thirty-year mortgage from 2021 did not feel the rate hikes at all. And banks themselves had a new source of income: the Fed was paying them above 5 percent interest just for parking reserves at the central bank. Banks could make money without lending.
Where the yield curve stands in September 2026
The two-year to ten-year spread turned positive in September 2024, and by that measure the recession signal has been off for two years. But the story is not over.
On September 16, the Federal Reserve, under its new chair Kevin Warsh, raised rates for the first time since July 2023. Inflation is still above the Fed's target. The ten-year yield has pushed near 5 percent, its highest since 2007, raising the cost of servicing a national debt above 36 trillion dollars. And the three-month to ten-year spread, the version the New York Fed uses in its recession model, has dipped below zero again. One version of the yield curve says the economy is fine. The other one is flashing the same warning it has flashed before every recession in living memory.
Nobody has found a better recession predictor. The next time the curve inverts cleanly, every bond desk, every Fed governor, and every economics columnist will watch it the way they always have. The difference is that this time they will also be arguing about whether the signal still means what it used to. Harvey's indicator predicted eight recessions in a row before it missed one. That is either the most impressive track record in economics, or a streak that just ended. Two years on, nobody is sure which.
Test what you learned
5 questions on this article. About two minutes, no signup.