
Ranking · Economy
Who owns US debt? Foreign holders by country
Japan is the largest foreign holder of US Treasury securities, with $1.10 trillion at the end of July 2026. The United Kingdom holds $998.3 billion and China $618.0 billion. Foreign governments and investors hold $9.25 trillion in all, 28.9% of the debt held by the public, so most US debt is owned inside the United States.
Five countries hold 39% of foreign-held US debt
Share of US Treasury securities held abroad, end of July 2026
 12%
12%
 11%
7%
5%
Everyone else 61%
11%
7%
5%
Everyone else 61%
- Japan $1.10tn
- United Kingdom $998bn
- China $618bn
- Belgium $471bn
- Luxembourg $442bn
- Everyone else $5.62tn
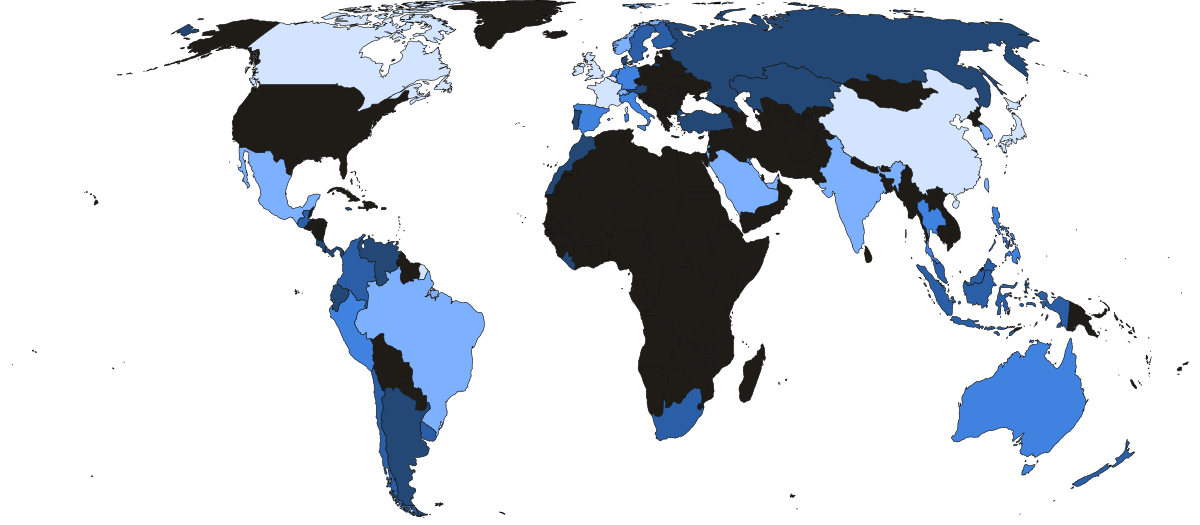
- Under $10bn
- $10bn–$50bn
- $50bn–$100bn
- $100bn–$300bn
- Over $300bn
- Not in this ranking
- Under $10bn
- $10bn–$50bn
- $50bn–$100bn
- $100bn–$300bn
- Over $300bn
- Not in this ranking
| # | Country | Holdings | July 2016 | Share of foreign holdings | Change since 2016 |
|---|---|---|---|---|---|
| 1 | Japan |
$1.10tn | $1.15tn | 11.9% | −4% |
| 2 | United Kingdom |
$998bn | $210bn | 10.8% | +375% |
| 3 |  China China |
$618bn | $1.22tn | 6.7% | −49% |
| 4 |  Belgium Belgium |
$471bn | $154bn | 5.1% | +205% |
| 5 |  Luxembourg Luxembourg |
$442bn | $224bn | 4.8% | +97% |
| 6 |  Canada Canada |
$426bn | $81.3bn | 4.6% | +424% |
| 7 |  Ireland Ireland |
$350bn | $269bn | 3.8% | +30% |
| 8 |  France France |
$348bn | $61.6bn | 3.8% | +466% |
| 9 |  Taiwan Taiwan |
$296bn | $192bn | 3.2% | +54% |
| 10 |  Switzerland Switzerland |
$285bn | $241bn | 3.1% | +18% |
| 11 |  Singapore Singapore |
$278bn | $104bn | 3.0% | +168% |
| 12 |  Norway Norway |
$207bn | $52.9bn | 2.2% | +291% |
| 13 |  India India |
$203bn | $124bn | 2.2% | +64% |
| 14 |  Brazil Brazil |
$168bn | $254bn | 1.8% | −34% |
| 15 |  Saudi Arabia Saudi Arabia |
$142bn | $96.5bn | 1.5% | +48% |
| 16 |  South Korea South Korea |
$132bn | $85.9bn | 1.4% | +53% |
| 17 |  United Arab Emirates United Arab Emirates |
$110bn | $66.0bn | 1.2% | +67% |
| 18 |  Israel Israel |
$107bn | $30.0bn | 1.2% | +257% |
| 19 |  Mexico Mexico |
$101bn | $48.3bn | 1.1% | +110% |
| 20 |  Germany Germany |
$98.2bn | $97.0bn | 1.1% | +1% |
| 21 |  Spain Spain |
$86.1bn | $39.1bn | 0.9% | +120% |
| 22 |  Thailand Thailand |
$81.5bn | $48.8bn | 0.9% | +67% |
| 23 |  Australia Australia |
$80.8bn | $30.9bn | 0.9% | +161% |
| 24 |  Kuwait Kuwait |
$69.2bn | $31.7bn | 0.7% | +118% |
| 25 |  Netherlands Netherlands |
$61.1bn | $49.7bn | 0.7% | +23% |
| 26 |  Italy Italy |
$60.8bn | $41.3bn | 0.7% | +47% |
| 27 |  Peru Peru |
$55.1bn | $12.7bn | 0.6% | +334% |
| 28 |  Philippines Philippines |
$50.9bn | $41.7bn | 0.6% | +22% |
| 29 |  Sweden Sweden |
$43.7bn | $40.0bn | 0.5% | +9% |
| 30 |  Colombia Colombia |
$43.0bn | $30.7bn | 0.5% | +40% |
| 31 |  Indonesia Indonesia |
$37.5bn | $22.2bn | 0.4% | +69% |
| 32 |  Chile Chile |
$36.4bn | $33.8bn | 0.4% | +8% |
| 33 |  Bahamas Bahamas |
$24.5bn | · | 0.3% | |
| 34 |  Malaysia Malaysia |
$19.4bn | $13.9bn | 0.2% | +40% |
| 35 |  New Zealand New Zealand |
$19.1bn | · | 0.2% | |
| 36 |  Guatemala Guatemala |
$18.9bn | · | 0.2% | |
| 37 |  Uruguay Uruguay |
$17.2bn | · | 0.2% | |
| 38 |  Finland Finland |
$13.8bn | $10.3bn | 0.1% | +34% |
| 39 |  South Africa South Africa |
$11.2bn | · | 0.1% | |
| 40 |  Argentina Argentina |
$9.4bn | · | 0.1% | |
| 41 |  Panama Panama |
$9.3bn | · | 0.1% | |
| 42 |  Kazakhstan Kazakhstan |
$9.1bn | $22.9bn | 0.1% | −60% |
| 43 |  Denmark Denmark |
$8.4bn | $22.8bn | 0.1% | −63% |
| 44 |  Austria Austria |
$6.0bn | · | 0.1% | |
| 45 |  Costa Rica Costa Rica |
$5.1bn | · | 0.1% | |
| 46 |  Morocco Morocco |
$4.8bn | · | 0.1% | |
| 47 |  Turkey Turkey |
$4.5bn | $59.7bn | 0.0% | −92% |
| 48 |  Trinidad and Tobago Trinidad and Tobago |
$4.1bn | · | 0.0% | |
| 49 |  Barbados Barbados |
$3.7bn | · | 0.0% | |
| 50 |  Jamaica Jamaica |
$2.2bn | · | 0.0% | |
| 51 |  Portugal Portugal |
$2.1bn | · | 0.0% | |
| 52 |  Ecuador Ecuador |
$2.1bn | · | 0.0% | |
| 53 |  Cyprus Cyprus |
$793m | · | 0.0% | |
| 54 |  Venezuela Venezuela |
$641m | · | 0.0% | |
| 55 |  Liberia Liberia |
$608m | · | 0.0% | |
| 56 |  Russia Russia |
$25m | $88.2bn | 0.0% | −100% |
| # | Country | July 2016 | Holdings | Share of foreign holdings | Change since 2016 |
|---|---|---|---|---|---|
| 1 | China |
$1.22tn | $618bn | 6.7% | −49% |
| 2 | Japan |
$1.15tn | $1.10tn | 11.9% | −4% |
| 3 | Ireland |
$269bn | $350bn | 3.8% | +30% |
| 4 | Brazil |
$254bn | $168bn | 1.8% | −34% |
| 5 | Switzerland |
$241bn | $285bn | 3.1% | +18% |
| 6 | Luxembourg |
$224bn | $442bn | 4.8% | +97% |
| 7 | United Kingdom |
$210bn | $998bn | 10.8% | +375% |
| 8 | Taiwan |
$192bn | $296bn | 3.2% | +54% |
| 9 | Belgium |
$154bn | $471bn | 5.1% | +205% |
| 10 | India |
$124bn | $203bn | 2.2% | +64% |
| 11 | Singapore |
$104bn | $278bn | 3.0% | +168% |
| 12 | Germany |
$97.0bn | $98.2bn | 1.1% | +1% |
| 13 | Saudi Arabia |
$96.5bn | $142bn | 1.5% | +48% |
| 14 | Russia |
$88.2bn | $25m | 0.0% | −100% |
| 15 | South Korea |
$85.9bn | $132bn | 1.4% | +53% |
| 16 | Canada |
$81.3bn | $426bn | 4.6% | +424% |
| 17 | United Arab Emirates |
$66.0bn | $110bn | 1.2% | +67% |
| 18 | France |
$61.6bn | $348bn | 3.8% | +466% |
| 19 | Turkey |
$59.7bn | $4.5bn | 0.0% | −92% |
| 20 | Norway |
$52.9bn | $207bn | 2.2% | +291% |
| 21 | Netherlands |
$49.7bn | $61.1bn | 0.7% | +23% |
| 22 | Thailand |
$48.8bn | $81.5bn | 0.9% | +67% |
| 23 | Mexico |
$48.3bn | $101bn | 1.1% | +110% |
| 24 | Philippines |
$41.7bn | $50.9bn | 0.6% | +22% |
| 25 | Italy |
$41.3bn | $60.8bn | 0.7% | +47% |
| 26 | Sweden |
$40.0bn | $43.7bn | 0.5% | +9% |
| 27 | Spain |
$39.1bn | $86.1bn | 0.9% | +120% |
| 28 | Chile |
$33.8bn | $36.4bn | 0.4% | +8% |
| 29 | Kuwait |
$31.7bn | $69.2bn | 0.7% | +118% |
| 30 | Australia |
$30.9bn | $80.8bn | 0.9% | +161% |
| 31 | Colombia |
$30.7bn | $43.0bn | 0.5% | +40% |
| 32 | Israel |
$30.0bn | $107bn | 1.2% | +257% |
| 33 | Kazakhstan |
$22.9bn | $9.1bn | 0.1% | −60% |
| 34 | Denmark |
$22.8bn | $8.4bn | 0.1% | −63% |
| 35 | Indonesia |
$22.2bn | $37.5bn | 0.4% | +69% |
| 36 | Malaysia |
$13.9bn | $19.4bn | 0.2% | +40% |
| 37 | Peru |
$12.7bn | $55.1bn | 0.6% | +334% |
| 38 | Finland |
$10.3bn | $13.8bn | 0.1% | +34% |
Why they rank where they do
-
Japan
Japan spent about $96.5 billion buying yen between July 30 and August 26, 2026, a monthly record. On July 31 the United States joined in, its first intervention to support the yen since June 1998. Japan's finance minister, Satsuki Katayama, said future interventions would be funded by borrowing dollars from the Federal Reserve against Treasuries rather than by selling them.
-
United Kingdom
The United Kingdom overtook China as the second-largest holder in March 2025. A Federal Reserve note says the rise reflects the growing importance of major financial and custodial centers. Treasuries held through London banks and asset managers for clients anywhere count as British.
-
Belgium
Euroclear in Brussels holds bonds for investors worldwide. The Congressional Research Service wrote that a Chinese investor using a Belgian bank would have those assets counted under Belgium. China's foreign exchange agency, SAFE, owns a stake in Euroclear.
-
Norway
Norway's oil fund held $199 billion of US Treasuries at the end of 2025. On September 1, 2026, the fund's manager proposed a change to its bond benchmark that would reduce its Treasuries by about $80 billion, not before 2027.
-
Saudi Arabia
The Treasury published Saudi Arabia's holdings separately for the first time on May 16, 2016. Since 1974 they had been grouped with 14 other countries as "oil exporters". Bloomberg traced this to Treasury Secretary William Simon's visit in July 1974, when King Faisal asked for Saudi purchases to stay secret.
-
Russia
In April 2018 the US imposed new sanctions on Russian oligarchs, officials and companies. Russia's recorded holdings fell from $96.1 billion in March 2018 to $14.9 billion in May 2018. Analysts at the Council on Foreign Relations estimated that about $38 billion was probably moved to custodians outside the US rather than sold.
Who owns most of the US debt?
American investors, the Federal Reserve and government trust funds own most of it. Total federal debt was $39.77 trillion on July 31, 2026, and it passed $40 trillion in September 2026. Of the July total, $7.73 trillion was held by government accounts such as Social Security's trust funds, and $32.05 trillion by the public.
The Treasury's breakdown for March 2026: foreign and international investors $9.36 trillion, mutual funds $5.12 trillion, the Federal Reserve about $4.39 trillion, banks $2.17 trillion, state and local governments $1.64 trillion, pension funds $1.18 trillion, insurance companies $0.60 trillion and US savings bonds $0.15 trillion. Other investors, such as individuals and businesses, held $6.82 trillion. The foreign share of the debt held by the public has fallen from 49.0% in June 2008 to 28.9% in July 2026.
Is China selling its US debt?
China's recorded holdings have fallen. They peaked at $1.32 trillion in November 2013. In July 2026 they were $618.0 billion, the lowest since August 2008. On February 9, 2026, Chinese regulators told commercial banks to limit their holdings of US Treasuries. China's central bank reported buying gold for 22 consecutive months from November 2024 to August 2026. At the end of August 2026 China's central bank held about 2,387 tonnes of gold.
But the fall may be smaller than it appears. Brad Setser of the Council on Foreign Relations argues that China now holds more Treasuries through custodians in other countries. Setser says US assets are still 50% to 55% of China's reserves. At the end of 2025, rising gold prices briefly made foreign central banks' gold worth more than their US Treasuries. By June 2026 Treasuries were worth more again.
- Russia−100%
- Turkey−92%
- China−49%
- Brazil−34%
- Japan−4%
Change in US Treasury holdings, July 2016 to July 2026. Countries that held at least $50 billion in 2016.
Why do financial centers hold so much US debt?
The Treasury records holdings by the country where the bonds are held in custody. That is not always the country of the real owner. The Treasury's own note says: "Since U.S. securities held in overseas custody accounts may not be attributed to the actual owners, the data may not provide a precise accounting of individual country ownership of Treasury securities."
Many US hedge funds are registered in the Cayman Islands. A Federal Reserve note found that the Treasury's data undercounted these funds' Treasuries by nearly $1.4 trillion at the end of 2024. Luxembourg and Ireland are home to many international investment funds, including dollar money market funds. The Cayman Islands held $460.1 billion and Hong Kong held $258.3 billion in July 2026. They are not ranked because they are territories.
How much does the US pay in interest on its debt?
In the 2025 fiscal year the US paid $970.4 billion in net interest on its debt, more than the $916.6 billion it spent on defense. Interest first passed defense spending in the 2024 fiscal year. In the first 11 months of the 2026 fiscal year, net interest was $1.017 trillion and defense $876.2 billion.
Moody's cut the US credit rating from Aaa to Aa1 on May 16, 2025. Since then none of the three major rating agencies gives the US its top rating. S&P has rated the US AA+ since 2011 and Fitch since 2023. The US dollar made up 57.13% of the world's foreign exchange reserves in the first quarter of 2026, according to the IMF.