Ranking · Economy
Trade with China by country
China made up 81.7% of North Korea's trade in goods in 2025, the highest share, followed by Eritrea at 73.3% and Mongolia at 62.3%. Among larger economies, China made up 30.4% of Australia's trade, 29.5% of Indonesia's, 28.7% of Vietnam's and 27.1% of Brazil's. Of 164 countries with both figures, 123 traded more with China than with the United States.
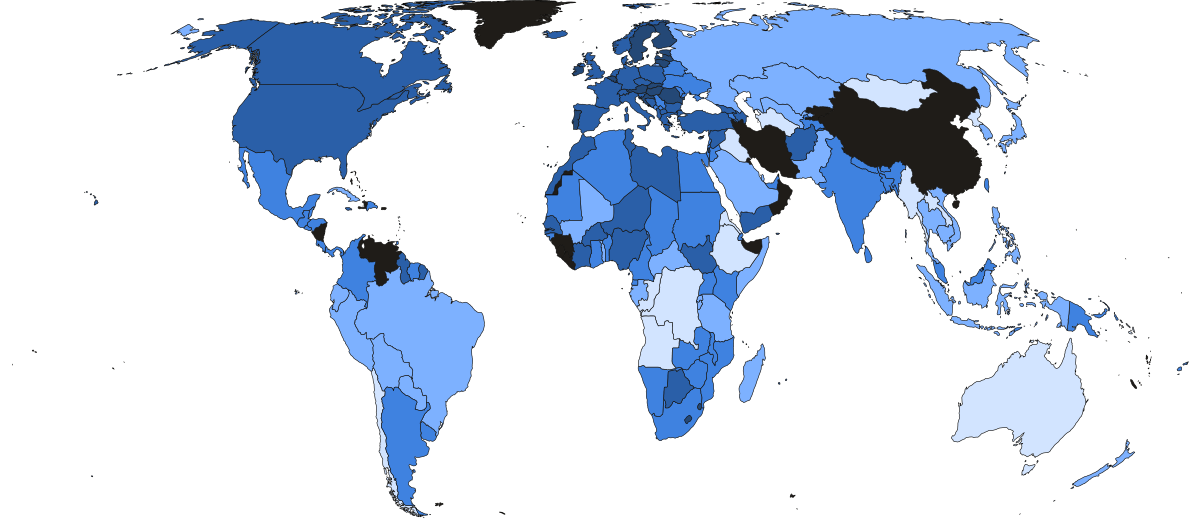
- Under 5%
- 5%–10%
- 10%–20%
- 20%–30%
- Over 30%
- Not in this ranking
- Under 5%
- 5%–10%
- 10%–20%
- 20%–30%
- Over 30%
- Not in this ranking
- Under $1bn
- $1bn–$10bn
- $10bn–$50bn
- $50bn–$150bn
- Over $150bn
- Not in this ranking
| # | Country | China's share | US share | Trade with China |
|---|---|---|---|---|
| 1 |  North Korea est. North Korea est. |
81.7% | 0.1% | $2.9bn |
| 2 |  Eritrea Eritrea |
73.3% | 4.7% | $1.0bn |
| 3 |  Mongolia Mongolia |
62.3% | 1.3% | $18.6bn |
| 4 |  Turkmenistan Turkmenistan |
55.8% | · | $9.7bn |
| 5 |  Republic of the Congo Republic of the Congo |
47.7% | 2.9% | $7.1bn |
| 6 |  DR Congo DR Congo |
46.0% | 1.0% | $29.1bn |
| 7 |  Solomon Islands est. Solomon Islands est. |
36.7% | 1.9% | $493m |
| 8 |  Angola Angola |
35.5% | 2.8% | $17.9bn |
| 9 |  Myanmar Myanmar |
34.9% | 2.4% | $10.3bn |
| 10 |  Laos Laos |
34.0% | 1.4% | $5.0bn |
| 11 |  Ethiopia Ethiopia |
33.6% | 6.7% | $8.3bn |
| 12 |  Chile Chile |
33.0% | 16.9% | $67.1bn |
| 13 |  Iraq est. Iraq est. |
30.8% | 6.0% | $50.2bn |
| 14 |  Australia Australia |
30.4% | 9.3% | $198bn |
| 15 |  Cambodia Cambodia |
29.9% | 21.7% | $18.6bn |
| 16 |  Peru Peru |
29.6% | 16.1% | $39.7bn |
| 17 |  Indonesia Indonesia |
29.5% | 8.4% | $155bn |
| 18 |  Vietnam Vietnam |
28.7% | 19.3% | $255bn |
| 19 |  Marshall Islands est. Marshall Islands est. |
27.9% | 0.9% | $6.1bn |
| 20 |  Gabon Gabon |
27.8% | 3.0% | $3.6bn |
| 21 |  Cuba Cuba |
27.6% | 4.5% | $2.5bn |
| 22 |  Brazil Brazil |
27.1% | 13.4% | $175bn |
| 23 |  Qatar Qatar |
26.4% | 5.5% | $27.2bn |
| 24 |  Kazakhstan Kazakhstan |
26.2% | 3.4% | $30.9bn |
| 25 |  Central African Republic Central African Republic |
25.6% | 3.6% | $263m |
| 26 |  Russia Russia |
24.2% | 3.2% | $160bn |
| 27 |  Pakistan Pakistan |
23.7% | 9.1% | $22.8bn |
| 28 |  New Zealand New Zealand |
23.6% | 11.0% | $22.4bn |
| 29 |  Paraguay Paraguay |
22.7% | 5.9% | $7.1bn |
| 30 |  Rwanda Rwanda |
22.6% | 1.3% | $1.2bn |
| 31 |  Nauru est. Nauru est. |
22.5% | 1.1% | $69m |
| 32 |  Burundi Burundi |
22.3% | · | $210m |
| 33 |  Philippines Philippines |
21.9% | 10.0% | $47.7bn |
| 34 |  Tanzania Tanzania |
21.8% | 2.3% | $6.6bn |
| 35 |  Bolivia Bolivia |
21.6% | 4.6% | $4.3bn |
| 36 |  Uzbekistan Uzbekistan |
21.6% | 1.0% | $47.3bn |
| 37 |  Thailand Thailand |
21.5% | 13.5% | $149bn |
| 38 |  Mali Mali |
21.2% | 1.8% | $1.9bn |
| 39 |  Madagascar Madagascar |
21.0% | 6.2% | $1.6bn |
| 40 |  Ecuador Ecuador |
20.6% | 23.0% | $14.4bn |
| 41 |  Somalia est. Somalia est. |
20.6% | 1.1% | $1.1bn |
| 42 |  Japan Japan |
20.3% | 15.1% | $304bn |
| 43 |  South Korea South Korea |
20.3% | 14.7% | $273bn |
| 44 |  Saudi Arabia Saudi Arabia |
20.3% | 6.1% | $114bn |
| 45 |  Togo Togo |
20.0% | 1.7% | $1.2bn |
| 46 |  Equatorial Guinea est. Equatorial Guinea est. |
19.8% | 5.2% | $921m |
| 47 |  Uruguay Uruguay |
19.6% | 9.7% | $4.7bn |
| 48 |  Papua New Guinea est. Papua New Guinea est. |
18.7% | 1.1% | $3.0bn |
| 49 |  Maldives Maldives |
18.6% | 3.8% | $699m |
| 50 |  Tajikistan Tajikistan |
18.6% | 2.5% | $1.5bn |
| 51 |  Namibia Namibia |
18.0% | 3.2% | $2.8bn |
| 52 |  Colombia Colombia |
17.9% | 26.5% | $21.0bn |
| 53 |  Mauritania Mauritania |
17.9% | 1.9% | $1.8bn |
| 54 |  Malaysia Malaysia |
17.7% | 12.0% | $127bn |
| 55 |  Bangladesh Bangladesh |
17.5% | 10.1% | $19.3bn |
| 56 |  Chad est. Chad est. |
17.4% | 2.3% | $1.1bn |
| 57 |  Algeria Algeria |
17.1% | 3.6% | $16.8bn |
| 58 |  Nepal Nepal |
17.1% | 3.2% | $2.7bn |
| 59 |  Taiwan Taiwan |
17.1% | 21.9% | $192bn |
| 60 |  Argentina Argentina |
17.0% | 9.1% | $27.7bn |
| 61 |  Ukraine Ukraine |
16.6% | 0.9% | $20.1bn |
| 62 |  South Africa South Africa |
16.5% | 7.0% | $37.4bn |
| 63 |  Bhutan Bhutan |
16.2% | 0.9% | $427m |
| 64 |  Brunei Brunei |
15.7% | 2.3% | $2.6bn |
| 65 |  Zambia Zambia |
15.7% | 1.1% | $5.7bn |
| 66 |  Uganda Uganda |
15.6% | 1.4% | $4.7bn |
| 67 |  Fiji Fiji |
15.5% | 6.5% | $685m |
| 68 |  Zimbabwe Zimbabwe |
15.5% | 0.9% | $2.8bn |
| 69 |  Kenya Kenya |
15.0% | 6.7% | $4.7bn |
| 70 |  Belize Belize |
14.9% | 39.1% | $260m |
| 71 |  El Salvador El Salvador |
14.9% | 28.1% | $3.6bn |
| 72 |  Guatemala Guatemala |
14.8% | 29.0% | $7.4bn |
| 73 |  Jordan Jordan |
14.8% | 13.5% | $6.3bn |
| 74 |  Cameroon Cameroon |
14.6% | 2.8% | $2.0bn |
| 75 |  Timor-Leste Timor-Leste |
14.6% | 2.1% | $153m |
| 76 |  Mauritius Mauritius |
14.5% | 3.8% | $1.2bn |
| 77 |  Guinea-Bissau Guinea-Bissau |
14.3% | · | $93m |
| 78 |  United Arab Emirates est. United Arab Emirates est. |
14.2% | 4.6% | $129bn |
| 79 |  Mozambique Mozambique |
14.0% | 1.5% | $2.3bn |
| 80 |  Dominican Republic Dominican Republic |
13.9% | 44.7% | $6.4bn |
| 81 |  Panama Panama |
13.5% | 16.9% | $2.2bn |
| 82 |  Honduras Honduras |
13.0% | 30.6% | $3.1bn |
| 83 |  Trinidad and Tobago Trinidad and Tobago |
12.9% | 31.5% | $1.7bn |
| 84 |  Egypt Egypt |
12.6% | 10.1% | $19.1bn |
| 85 |  Armenia Armenia |
12.4% | 1.6% | $6.8bn |
| 86 |  Sudan Sudan |
12.2% | · | $1.8bn |
| 87 |  Sri Lanka Sri Lanka |
12.0% | 9.5% | $4.6bn |
| 88 |  India India |
11.9% | 11.9% | $143bn |
| 89 |  Ghana Ghana |
11.8% | 4.7% | $6.1bn |
| 90 |  Singapore Singapore |
11.7% | 10.1% | $125bn |
| 91 |  Kosovo Kosovo |
11.6% | 1.6% | $1.0bn |
| 92 |  Belarus Belarus |
11.4% | 0.3% | $5.9bn |
| 93 |  Israel Israel |
11.4% | 16.6% | $17.5bn |
| 94 |  Micronesia est. Micronesia est. |
11.3% | 21.4% | $87m |
| 95 |  Montenegro Montenegro |
11.3% | 1.3% | $721m |
| 96 |  Djibouti Djibouti |
11.2% | 1.5% | $1.0bn |
| 97 |  Suriname Suriname |
11.2% | 24.2% | $360m |
| 98 |  Mexico Mexico |
11.1% | 59.7% | $151bn |
| 99 |  Serbia Serbia |
11.1% | 1.9% | $9.4bn |
| 100 |  Lebanon Lebanon |
10.7% | 2.5% | $2.6bn |
| 101 |  Costa Rica Costa Rica |
10.6% | 42.0% | $5.1bn |
| 102 |  Malawi Malawi |
10.5% | · | $427m |
| 103 |  Benin Benin |
10.4% | 5.6% | $577m |
| 104 |  Moldova Moldova |
10.3% | 0.3% | $1.5bn |
| 105 |  Gambia Gambia |
10.1% | 3.3% | $84m |
| 106 |  Azerbaijan Azerbaijan |
9.9% | 3.2% | $4.9bn |
| 107 |  Jamaica Jamaica |
9.9% | 38.4% | $905m |
| 108 |  Senegal Senegal |
9.5% | 3.8% | $1.9bn |
| 109 |  Libya Libya |
9.2% | 3.1% | $4.3bn |
| 110 |  Comoros Comoros |
9.1% | 0.2% | $31m |
| 111 |  Georgia Georgia |
8.9% | 11.2% | $2.3bn |
| 112 |  Tonga Tonga |
8.9% | 11.1% | $25m |
| 113 |  United States United States |
8.9% | · | $501bn |
| 114 |  Albania Albania |
8.7% | 1.7% | $1.3bn |
| 115 |  Côte d'Ivoire Côte d'Ivoire |
8.7% | 4.7% | $4.1bn |
| 116 |  Yemen Yemen |
8.7% | · | $408m |
| 117 |  Bahrain Bahrain |
8.6% | 7.5% | $2.4bn |
| 118 |  United Kingdom United Kingdom |
8.6% | 11.9% | $114bn |
| 119 |  South Sudan est. South Sudan est. |
8.5% | 0.4% | $360m |
| 120 |  Iceland Iceland |
8.3% | 7.8% | $1.5bn |
| 121 |  Netherlands Netherlands |
8.3% | 6.9% | $152bn |
| 122 |  Turkey Turkey |
8.3% | 5.4% | $52.8bn |
| 123 |  Afghanistan Afghanistan |
8.2% | 1.0% | $470m |
| 124 |  Nigeria Nigeria |
8.2% | 7.3% | $6.2bn |
| 125 |  Burkina Faso Burkina Faso |
8.1% | 1.8% | $1.4bn |
| 126 |  Canada Canada |
8.1% | 58.7% | $93.3bn |
| 127 |  Antigua and Barbuda Antigua and Barbuda |
7.9% | 42.9% | $47m |
| 128 |  Morocco Morocco |
7.7% | 6.8% | $14.8bn |
| 129 |  Syria Syria |
7.7% | 0.2% | $894m |
| 130 |  Palau Palau |
7.5% | 33.7% | $37m |
| 131 |  Saint Vincent and the Grenadines Saint Vincent and the Grenadines |
7.5% | 32.9% | $34m |
| 132 |  Slovenia Slovenia |
7.2% | 0.8% | $13.4bn |
| 133 |  Niger Niger |
7.0% | 1.1% | $515m |
| 134 |  Bosnia and Herzegovina Bosnia and Herzegovina |
6.9% | 1.3% | $1.9bn |
| 135 |  Tunisia Tunisia |
6.9% | 2.6% | $3.4bn |
| 136 |  Denmark Denmark |
6.8% | 5.8% | $19.3bn |
| 137 |  North Macedonia North Macedonia |
6.8% | 2.2% | $1.5bn |
| 138 |  Barbados Barbados |
6.7% | 35.0% | $180m |
| 139 |  Norway Norway |
6.4% | 5.2% | $17.6bn |
| 140 |  Botswana Botswana |
6.3% | · | $654m |
| 141 |  Germany Germany |
6.3% | 7.4% | $208bn |
| 142 |  Spain Spain |
6.2% | 5.1% | $59.3bn |
| 143 |  Italy Italy |
6.1% | 8.6% | $84.6bn |
| 144 |  Czechia Czechia |
5.9% | 2.2% | $31.6bn |
| 145 |  Switzerland Switzerland |
5.8% | 17.7% | $63.0bn |
| 146 |  Greece Greece |
5.6% | 3.7% | $8.1bn |
| 147 |  Cyprus Cyprus |
5.5% | 1.4% | $1.1bn |
| 148 |  Poland Poland |
5.5% | 3.3% | $45.8bn |
| 149 |  France France |
5.4% | 7.3% | $78.5bn |
| 150 |  Guyana Guyana |
5.4% | 26.8% | $1.9bn |
| 151 |  Bulgaria Bulgaria |
5.1% | 2.2% | $5.4bn |
| 152 |  Belgium Belgium |
4.8% | 6.8% | $53.8bn |
| 153 |  Hungary Hungary |
4.8% | 2.6% | $15.5bn |
| 154 |  Finland Finland |
4.7% | 7.2% | $8.0bn |
| 155 |  Ireland Ireland |
4.6% | 33.0% | $20.6bn |
| 156 |  Sweden Sweden |
4.6% | 6.3% | $18.8bn |
| 157 |  Lesotho Lesotho |
4.4% | 6.0% | $113m |
| 158 |  Romania Romania |
4.3% | 1.6% | $11.1bn |
| 159 |  Seychelles Seychelles |
4.3% | 0.6% | $95m |
| 160 |  Palestine Palestine |
3.5% | 1.3% | $1.0bn |
| 161 |  Malta Malta |
3.4% | 2.9% | $454m |
| 162 |  Portugal Portugal |
3.4% | 3.7% | $7.3bn |
| 163 |  Eswatini Eswatini |
3.4% | 1.4% | $166m |
| 164 |  Estonia Estonia |
3.3% | 2.2% | $1.5bn |
| 165 |  Lithuania Lithuania |
3.1% | 4.4% | $2.8bn |
| 166 |  Austria Austria |
2.9% | 4.4% | $13.3bn |
| 167 |  Grenada Grenada |
2.9% | 38.7% | $19m |
| 168 |  Latvia Latvia |
2.9% | 2.0% | $1.4bn |
| 169 |  Slovakia Slovakia |
2.8% | 2.1% | $6.9bn |
| 170 |  Luxembourg Luxembourg |
2.5% | 2.8% | $1.1bn |
| 171 |  Croatia Croatia |
2.4% | 2.1% | $1.9bn |
| 172 |  San Marino est. San Marino est. |
2.4% | 14.4% | $19m |
| 173 |  Tuvalu est. Tuvalu est. |
1.8% | · | $1m |
| # | Country | US share | China's share | Trade with China |
|---|---|---|---|---|
| 1 | Mexico |
59.7% | 11.1% | $151bn |
| 2 | Canada |
58.7% | 8.1% | $93.3bn |
| 3 | Dominican Republic |
44.7% | 13.9% | $6.4bn |
| 4 | Antigua and Barbuda |
42.9% | 7.9% | $47m |
| 5 | Costa Rica |
42.0% | 10.6% | $5.1bn |
| 6 | Belize |
39.1% | 14.9% | $260m |
| 7 | Grenada |
38.7% | 2.9% | $19m |
| 8 | Jamaica |
38.4% | 9.9% | $905m |
| 9 | Barbados |
35.0% | 6.7% | $180m |
| 10 | Palau |
33.7% | 7.5% | $37m |
| 11 | Ireland |
33.0% | 4.6% | $20.6bn |
| 12 | Saint Vincent and the Grenadines |
32.9% | 7.5% | $34m |
| 13 | Trinidad and Tobago |
31.5% | 12.9% | $1.7bn |
| 14 |  Dominica Dominica |
31.2% | · | · |
| 15 | Honduras |
30.6% | 13.0% | $3.1bn |
| 16 | Guatemala |
29.0% | 14.8% | $7.4bn |
| 17 | El Salvador |
28.1% | 14.9% | $3.6bn |
| 18 | Guyana |
26.8% | 5.4% | $1.9bn |
| 19 | Colombia |
26.5% | 17.9% | $21.0bn |
| 20 | Suriname |
24.2% | 11.2% | $360m |
| 21 | Ecuador |
23.0% | 20.6% | $14.4bn |
| 22 | Taiwan |
21.9% | 17.1% | $192bn |
| 23 | Cambodia |
21.7% | 29.9% | $18.6bn |
| 24 | Micronesia est. |
21.4% | 11.3% | $87m |
| 25 | Vietnam |
19.3% | 28.7% | $255bn |
| 26 | Switzerland |
17.7% | 5.8% | $63.0bn |
| 27 | Chile |
16.9% | 33.0% | $67.1bn |
| 28 | Panama |
16.9% | 13.5% | $2.2bn |
| 29 | Israel |
16.6% | 11.4% | $17.5bn |
| 30 | Peru |
16.1% | 29.6% | $39.7bn |
| 31 |  Samoa Samoa |
15.5% | · | · |
| 32 | Japan |
15.1% | 20.3% | $304bn |
| 33 | South Korea |
14.7% | 20.3% | $273bn |
| 34 | San Marino est. |
14.4% | 2.4% | $19m |
| 35 | Thailand |
13.5% | 21.5% | $149bn |
| 36 | Jordan |
13.5% | 14.8% | $6.3bn |
| 37 | Brazil |
13.4% | 27.1% | $175bn |
| 38 | Malaysia |
12.0% | 17.7% | $127bn |
| 39 | India |
11.9% | 11.9% | $143bn |
| 40 | United Kingdom |
11.9% | 8.6% | $114bn |
| 41 | Georgia |
11.2% | 8.9% | $2.3bn |
| 42 | Tonga |
11.1% | 8.9% | $25m |
| 43 | New Zealand |
11.0% | 23.6% | $22.4bn |
| 44 |  Saint Lucia Saint Lucia |
10.7% | · | · |
| 45 | Bangladesh |
10.1% | 17.5% | $19.3bn |
| 46 | Egypt |
10.1% | 12.6% | $19.1bn |
| 47 | Singapore |
10.1% | 11.7% | $125bn |
| 48 | Philippines |
10.0% | 21.9% | $47.7bn |
| 49 | Uruguay |
9.7% | 19.6% | $4.7bn |
| 50 | Sri Lanka |
9.5% | 12.0% | $4.6bn |
| 51 | Australia |
9.3% | 30.4% | $198bn |
| 52 | Pakistan |
9.1% | 23.7% | $22.8bn |
| 53 | Argentina |
9.1% | 17.0% | $27.7bn |
| 54 |  China China |
8.8% | · | · |
| 55 | Italy |
8.6% | 6.1% | $84.6bn |
| 56 | Indonesia |
8.4% | 29.5% | $155bn |
| 57 | Iceland |
7.8% | 8.3% | $1.5bn |
| 58 | Bahrain |
7.5% | 8.6% | $2.4bn |
| 59 | Germany |
7.4% | 6.3% | $208bn |
| 60 | Nigeria |
7.3% | 8.2% | $6.2bn |
| 61 | France |
7.3% | 5.4% | $78.5bn |
| 62 | Finland |
7.2% | 4.7% | $8.0bn |
| 63 | South Africa |
7.0% | 16.5% | $37.4bn |
| 64 | Netherlands |
6.9% | 8.3% | $152bn |
| 65 | Morocco |
6.8% | 7.7% | $14.8bn |
| 66 | Belgium |
6.8% | 4.8% | $53.8bn |
| 67 | Ethiopia |
6.7% | 33.6% | $8.3bn |
| 68 | Kenya |
6.7% | 15.0% | $4.7bn |
| 69 | Fiji |
6.5% | 15.5% | $685m |
| 70 | Sweden |
6.3% | 4.6% | $18.8bn |
| 71 | Madagascar |
6.2% | 21.0% | $1.6bn |
| 72 | Saudi Arabia |
6.1% | 20.3% | $114bn |
| 73 |  Liberia Liberia |
6.1% | · | · |
| 74 | Iraq est. |
6.0% | 30.8% | $50.2bn |
| 75 | Lesotho |
6.0% | 4.4% | $113m |
| 76 | Paraguay |
5.9% | 22.7% | $7.1bn |
| 77 | Denmark |
5.8% | 6.8% | $19.3bn |
| 78 | Benin |
5.6% | 10.4% | $577m |
| 79 | Qatar |
5.5% | 26.4% | $27.2bn |
| 80 | Turkey |
5.4% | 8.3% | $52.8bn |
| 81 | Equatorial Guinea est. |
5.2% | 19.8% | $921m |
| 82 | Norway |
5.2% | 6.4% | $17.6bn |
| 83 | Spain |
5.1% | 6.2% | $59.3bn |
| 84 | Eritrea |
4.7% | 73.3% | $1.0bn |
| 85 | Ghana |
4.7% | 11.8% | $6.1bn |
| 86 | Côte d'Ivoire |
4.7% | 8.7% | $4.1bn |
| 87 | Bolivia |
4.6% | 21.6% | $4.3bn |
| 88 | United Arab Emirates est. |
4.6% | 14.2% | $129bn |
| 89 | Cuba |
4.5% | 27.6% | $2.5bn |
| 90 | Lithuania |
4.4% | 3.1% | $2.8bn |
| 91 | Austria |
4.4% | 2.9% | $13.3bn |
| 92 | Maldives |
3.8% | 18.6% | $699m |
| 93 | Mauritius |
3.8% | 14.5% | $1.2bn |
| 94 | Senegal |
3.8% | 9.5% | $1.9bn |
| 95 | Greece |
3.7% | 5.6% | $8.1bn |
| 96 | Portugal |
3.7% | 3.4% | $7.3bn |
| 97 | Central African Republic |
3.6% | 25.6% | $263m |
| 98 | Algeria |
3.6% | 17.1% | $16.8bn |
| 99 | Kazakhstan |
3.4% | 26.2% | $30.9bn |
| 100 | Gambia |
3.3% | 10.1% | $84m |
| 101 | Poland |
3.3% | 5.5% | $45.8bn |
| 102 | Russia |
3.2% | 24.2% | $160bn |
| 103 | Namibia |
3.2% | 18.0% | $2.8bn |
| 104 | Nepal |
3.2% | 17.1% | $2.7bn |
| 105 | Azerbaijan |
3.2% | 9.9% | $4.9bn |
| 106 | Libya |
3.1% | 9.2% | $4.3bn |
| 107 | Gabon |
3.0% | 27.8% | $3.6bn |
| 108 | Republic of the Congo |
2.9% | 47.7% | $7.1bn |
| 109 | Malta |
2.9% | 3.4% | $454m |
| 110 | Angola |
2.8% | 35.5% | $17.9bn |
| 111 | Cameroon |
2.8% | 14.6% | $2.0bn |
| 112 | Luxembourg |
2.8% | 2.5% | $1.1bn |
| 113 | Tunisia |
2.6% | 6.9% | $3.4bn |
| 114 | Hungary |
2.6% | 4.8% | $15.5bn |
| 115 | Tajikistan |
2.5% | 18.6% | $1.5bn |
| 116 | Lebanon |
2.5% | 10.7% | $2.6bn |
| 117 | Myanmar |
2.4% | 34.9% | $10.3bn |
| 118 | Tanzania |
2.3% | 21.8% | $6.6bn |
| 119 | Chad est. |
2.3% | 17.4% | $1.1bn |
| 120 | Brunei |
2.3% | 15.7% | $2.6bn |
| 121 | North Macedonia |
2.2% | 6.8% | $1.5bn |
| 122 | Czechia |
2.2% | 5.9% | $31.6bn |
| 123 | Bulgaria |
2.2% | 5.1% | $5.4bn |
| 124 | Estonia |
2.2% | 3.3% | $1.5bn |
| 125 | Timor-Leste |
2.1% | 14.6% | $153m |
| 126 | Slovakia |
2.1% | 2.8% | $6.9bn |
| 127 | Croatia |
2.1% | 2.4% | $1.9bn |
| 128 | Latvia |
2.0% | 2.9% | $1.4bn |
| 129 | Solomon Islands est. |
1.9% | 36.7% | $493m |
| 130 | Mauritania |
1.9% | 17.9% | $1.8bn |
| 131 | Serbia |
1.9% | 11.1% | $9.4bn |
| 132 | Mali |
1.8% | 21.2% | $1.9bn |
| 133 | Burkina Faso |
1.8% | 8.1% | $1.4bn |
| 134 | Togo |
1.7% | 20.0% | $1.2bn |
| 135 | Albania |
1.7% | 8.7% | $1.3bn |
| 136 | Armenia |
1.6% | 12.4% | $6.8bn |
| 137 | Kosovo |
1.6% | 11.6% | $1.0bn |
| 138 | Romania |
1.6% | 4.3% | $11.1bn |
| 139 | Mozambique |
1.5% | 14.0% | $2.3bn |
| 140 | Djibouti |
1.5% | 11.2% | $1.0bn |
| 141 | Laos |
1.4% | 34.0% | $5.0bn |
| 142 | Uganda |
1.4% | 15.6% | $4.7bn |
| 143 | Cyprus |
1.4% | 5.5% | $1.1bn |
| 144 | Eswatini |
1.4% | 3.4% | $166m |
| 145 | Mongolia |
1.3% | 62.3% | $18.6bn |
| 146 | Rwanda |
1.3% | 22.6% | $1.2bn |
| 147 | Montenegro |
1.3% | 11.3% | $721m |
| 148 | Bosnia and Herzegovina |
1.3% | 6.9% | $1.9bn |
| 149 | Palestine |
1.3% | 3.5% | $1.0bn |
| 150 |  Cape Verde Cape Verde |
1.3% | · | · |
| 151 | Nauru est. |
1.1% | 22.5% | $69m |
| 152 | Somalia est. |
1.1% | 20.6% | $1.1bn |
| 153 | Papua New Guinea est. |
1.1% | 18.7% | $3.0bn |
| 154 | Zambia |
1.1% | 15.7% | $5.7bn |
| 155 | Niger |
1.1% | 7.0% | $515m |
| 156 | DR Congo |
1.0% | 46.0% | $29.1bn |
| 157 | Uzbekistan |
1.0% | 21.6% | $47.3bn |
| 158 | Afghanistan |
1.0% | 8.2% | $470m |
| 159 | Marshall Islands est. |
0.9% | 27.9% | $6.1bn |
| 160 | Ukraine |
0.9% | 16.6% | $20.1bn |
| 161 | Bhutan |
0.9% | 16.2% | $427m |
| 162 | Zimbabwe |
0.9% | 15.5% | $2.8bn |
| 163 | Slovenia |
0.8% | 7.2% | $13.4bn |
| 164 |  Kiribati Kiribati |
0.8% | · | · |
| 165 | Seychelles |
0.6% | 4.3% | $95m |
| 166 |  São Tomé and Príncipe São Tomé and Príncipe |
0.6% | · | · |
| 167 | South Sudan est. |
0.4% | 8.5% | $360m |
| 168 | Belarus |
0.3% | 11.4% | $5.9bn |
| 169 | Moldova |
0.3% | 10.3% | $1.5bn |
| 170 | Comoros |
0.2% | 9.1% | $31m |
| 171 | Syria |
0.2% | 7.7% | $894m |
| 172 | North Korea est. |
0.1% | 81.7% | $2.9bn |
| # | Country | Trade with China | China's share | US share |
|---|---|---|---|---|
| 1 | United States |
$501bn | 8.9% | · |
| 2 | Japan |
$304bn | 20.3% | 15.1% |
| 3 | South Korea |
$273bn | 20.3% | 14.7% |
| 4 | Vietnam |
$255bn | 28.7% | 19.3% |
| 5 | Germany |
$208bn | 6.3% | 7.4% |
| 6 | Australia |
$198bn | 30.4% | 9.3% |
| 7 | Taiwan |
$192bn | 17.1% | 21.9% |
| 8 | Brazil |
$175bn | 27.1% | 13.4% |
| 9 | Russia |
$160bn | 24.2% | 3.2% |
| 10 | Indonesia |
$155bn | 29.5% | 8.4% |
| 11 | Netherlands |
$152bn | 8.3% | 6.9% |
| 12 | Mexico |
$151bn | 11.1% | 59.7% |
| 13 | Thailand |
$149bn | 21.5% | 13.5% |
| 14 | India |
$143bn | 11.9% | 11.9% |
| 15 | United Arab Emirates est. |
$129bn | 14.2% | 4.6% |
| 16 | Malaysia |
$127bn | 17.7% | 12.0% |
| 17 | Singapore |
$125bn | 11.7% | 10.1% |
| 18 | Saudi Arabia |
$114bn | 20.3% | 6.1% |
| 19 | United Kingdom |
$114bn | 8.6% | 11.9% |
| 20 | Canada |
$93.3bn | 8.1% | 58.7% |
| 21 | Italy |
$84.6bn | 6.1% | 8.6% |
| 22 | France |
$78.5bn | 5.4% | 7.3% |
| 23 | Chile |
$67.1bn | 33.0% | 16.9% |
| 24 | Switzerland |
$63.0bn | 5.8% | 17.7% |
| 25 | Spain |
$59.3bn | 6.2% | 5.1% |
| 26 | Belgium |
$53.8bn | 4.8% | 6.8% |
| 27 | Turkey |
$52.8bn | 8.3% | 5.4% |
| 28 | Iraq est. |
$50.2bn | 30.8% | 6.0% |
| 29 | Philippines |
$47.7bn | 21.9% | 10.0% |
| 30 | Uzbekistan |
$47.3bn | 21.6% | 1.0% |
| 31 | Poland |
$45.8bn | 5.5% | 3.3% |
| 32 | Peru |
$39.7bn | 29.6% | 16.1% |
| 33 | South Africa |
$37.4bn | 16.5% | 7.0% |
| 34 | Czechia |
$31.6bn | 5.9% | 2.2% |
| 35 | Kazakhstan |
$30.9bn | 26.2% | 3.4% |
| 36 | DR Congo |
$29.1bn | 46.0% | 1.0% |
| 37 | Argentina |
$27.7bn | 17.0% | 9.1% |
| 38 | Qatar |
$27.2bn | 26.4% | 5.5% |
| 39 | Pakistan |
$22.8bn | 23.7% | 9.1% |
| 40 | New Zealand |
$22.4bn | 23.6% | 11.0% |
| 41 | Colombia |
$21.0bn | 17.9% | 26.5% |
| 42 | Ireland |
$20.6bn | 4.6% | 33.0% |
| 43 | Ukraine |
$20.1bn | 16.6% | 0.9% |
| 44 | Denmark |
$19.3bn | 6.8% | 5.8% |
| 45 | Bangladesh |
$19.3bn | 17.5% | 10.1% |
| 46 | Egypt |
$19.1bn | 12.6% | 10.1% |
| 47 | Sweden |
$18.8bn | 4.6% | 6.3% |
| 48 | Mongolia |
$18.6bn | 62.3% | 1.3% |
| 49 | Cambodia |
$18.6bn | 29.9% | 21.7% |
| 50 | Angola |
$17.9bn | 35.5% | 2.8% |
| 51 | Norway |
$17.6bn | 6.4% | 5.2% |
| 52 | Israel |
$17.5bn | 11.4% | 16.6% |
| 53 | Algeria |
$16.8bn | 17.1% | 3.6% |
| 54 | Hungary |
$15.5bn | 4.8% | 2.6% |
| 55 | Morocco |
$14.8bn | 7.7% | 6.8% |
| 56 | Ecuador |
$14.4bn | 20.6% | 23.0% |
| 57 | Slovenia |
$13.4bn | 7.2% | 0.8% |
| 58 | Austria |
$13.3bn | 2.9% | 4.4% |
| 59 | Romania |
$11.1bn | 4.3% | 1.6% |
| 60 | Myanmar |
$10.3bn | 34.9% | 2.4% |
| 61 | Turkmenistan |
$9.7bn | 55.8% | · |
| 62 | Serbia |
$9.4bn | 11.1% | 1.9% |
| 63 | Ethiopia |
$8.3bn | 33.6% | 6.7% |
| 64 | Greece |
$8.1bn | 5.6% | 3.7% |
| 65 | Finland |
$8.0bn | 4.7% | 7.2% |
| 66 | Guatemala |
$7.4bn | 14.8% | 29.0% |
| 67 | Portugal |
$7.3bn | 3.4% | 3.7% |
| 68 | Republic of the Congo |
$7.1bn | 47.7% | 2.9% |
| 69 | Paraguay |
$7.1bn | 22.7% | 5.9% |
| 70 | Slovakia |
$6.9bn | 2.8% | 2.1% |
| 71 | Armenia |
$6.8bn | 12.4% | 1.6% |
| 72 | Tanzania |
$6.6bn | 21.8% | 2.3% |
| 73 | Dominican Republic |
$6.4bn | 13.9% | 44.7% |
| 74 | Jordan |
$6.3bn | 14.8% | 13.5% |
| 75 | Nigeria |
$6.2bn | 8.2% | 7.3% |
| 76 | Ghana |
$6.1bn | 11.8% | 4.7% |
| 77 | Marshall Islands est. |
$6.1bn | 27.9% | 0.9% |
| 78 | Belarus |
$5.9bn | 11.4% | 0.3% |
| 79 | Zambia |
$5.7bn | 15.7% | 1.1% |
| 80 | Bulgaria |
$5.4bn | 5.1% | 2.2% |
| 81 | Costa Rica |
$5.1bn | 10.6% | 42.0% |
| 82 | Laos |
$5.0bn | 34.0% | 1.4% |
| 83 | Azerbaijan |
$4.9bn | 9.9% | 3.2% |
| 84 | Uruguay |
$4.7bn | 19.6% | 9.7% |
| 85 | Uganda |
$4.7bn | 15.6% | 1.4% |
| 86 | Kenya |
$4.7bn | 15.0% | 6.7% |
| 87 | Sri Lanka |
$4.6bn | 12.0% | 9.5% |
| 88 | Libya |
$4.3bn | 9.2% | 3.1% |
| 89 | Bolivia |
$4.3bn | 21.6% | 4.6% |
| 90 | Côte d'Ivoire |
$4.1bn | 8.7% | 4.7% |
| 91 | El Salvador |
$3.6bn | 14.9% | 28.1% |
| 92 | Gabon |
$3.6bn | 27.8% | 3.0% |
| 93 | Tunisia |
$3.4bn | 6.9% | 2.6% |
| 94 | Honduras |
$3.1bn | 13.0% | 30.6% |
| 95 | Papua New Guinea est. |
$3.0bn | 18.7% | 1.1% |
| 96 | North Korea est. |
$2.9bn | 81.7% | 0.1% |
| 97 | Namibia |
$2.8bn | 18.0% | 3.2% |
| 98 | Lithuania |
$2.8bn | 3.1% | 4.4% |
| 99 | Zimbabwe |
$2.8bn | 15.5% | 0.9% |
| 100 | Nepal |
$2.7bn | 17.1% | 3.2% |
| 101 | Brunei |
$2.6bn | 15.7% | 2.3% |
| 102 | Lebanon |
$2.6bn | 10.7% | 2.5% |
| 103 | Cuba |
$2.5bn | 27.6% | 4.5% |
| 104 | Bahrain |
$2.4bn | 8.6% | 7.5% |
| 105 | Mozambique |
$2.3bn | 14.0% | 1.5% |
| 106 | Georgia |
$2.3bn | 8.9% | 11.2% |
| 107 | Panama |
$2.2bn | 13.5% | 16.9% |
| 108 | Cameroon |
$2.0bn | 14.6% | 2.8% |
| 109 | Croatia |
$1.9bn | 2.4% | 2.1% |
| 110 | Mali |
$1.9bn | 21.2% | 1.8% |
| 111 | Bosnia and Herzegovina |
$1.9bn | 6.9% | 1.3% |
| 112 | Senegal |
$1.9bn | 9.5% | 3.8% |
| 113 | Guyana |
$1.9bn | 5.4% | 26.8% |
| 114 | Sudan |
$1.8bn | 12.2% | · |
| 115 | Mauritania |
$1.8bn | 17.9% | 1.9% |
| 116 | Trinidad and Tobago |
$1.7bn | 12.9% | 31.5% |
| 117 | Madagascar |
$1.6bn | 21.0% | 6.2% |
| 118 | Estonia |
$1.5bn | 3.3% | 2.2% |
| 119 | Iceland |
$1.5bn | 8.3% | 7.8% |
| 120 | Moldova |
$1.5bn | 10.3% | 0.3% |
| 121 | North Macedonia |
$1.5bn | 6.8% | 2.2% |
| 122 | Tajikistan |
$1.5bn | 18.6% | 2.5% |
| 123 | Burkina Faso |
$1.4bn | 8.1% | 1.8% |
| 124 | Latvia |
$1.4bn | 2.9% | 2.0% |
| 125 | Albania |
$1.3bn | 8.7% | 1.7% |
| 126 | Rwanda |
$1.2bn | 22.6% | 1.3% |
| 127 | Mauritius |
$1.2bn | 14.5% | 3.8% |
| 128 | Togo |
$1.2bn | 20.0% | 1.7% |
| 129 | Luxembourg |
$1.1bn | 2.5% | 2.8% |
| 130 | Chad est. |
$1.1bn | 17.4% | 2.3% |
| 131 | Cyprus |
$1.1bn | 5.5% | 1.4% |
| 132 | Somalia est. |
$1.1bn | 20.6% | 1.1% |
| 133 | Kosovo |
$1.0bn | 11.6% | 1.6% |
| 134 | Djibouti |
$1.0bn | 11.2% | 1.5% |
| 135 | Palestine |
$1.0bn | 3.5% | 1.3% |
| 136 | Eritrea |
$1.0bn | 73.3% | 4.7% |
| 137 | Equatorial Guinea est. |
$921m | 19.8% | 5.2% |
| 138 | Jamaica |
$905m | 9.9% | 38.4% |
| 139 | Syria |
$894m | 7.7% | 0.2% |
| 140 | Montenegro |
$721m | 11.3% | 1.3% |
| 141 | Maldives |
$699m | 18.6% | 3.8% |
| 142 | Fiji |
$685m | 15.5% | 6.5% |
| 143 | Botswana |
$654m | 6.3% | · |
| 144 | Benin |
$577m | 10.4% | 5.6% |
| 145 | Niger |
$515m | 7.0% | 1.1% |
| 146 | Solomon Islands est. |
$493m | 36.7% | 1.9% |
| 147 | Afghanistan |
$470m | 8.2% | 1.0% |
| 148 | Malta |
$454m | 3.4% | 2.9% |
| 149 | Bhutan |
$427m | 16.2% | 0.9% |
| 150 | Malawi |
$427m | 10.5% | · |
| 151 | Yemen |
$408m | 8.7% | · |
| 152 | Suriname |
$360m | 11.2% | 24.2% |
| 153 | South Sudan est. |
$360m | 8.5% | 0.4% |
| 154 | Central African Republic |
$263m | 25.6% | 3.6% |
| 155 | Belize |
$260m | 14.9% | 39.1% |
| 156 | Burundi |
$210m | 22.3% | · |
| 157 | Barbados |
$180m | 6.7% | 35.0% |
| 158 | Eswatini |
$166m | 3.4% | 1.4% |
| 159 | Timor-Leste |
$153m | 14.6% | 2.1% |
| 160 | Lesotho |
$113m | 4.4% | 6.0% |
| 161 | Seychelles |
$95m | 4.3% | 0.6% |
| 162 | Guinea-Bissau |
$93m | 14.3% | · |
| 163 | Micronesia est. |
$87m | 11.3% | 21.4% |
| 164 | Gambia |
$84m | 10.1% | 3.3% |
| 165 | Nauru est. |
$69m | 22.5% | 1.1% |
| 166 | Antigua and Barbuda |
$47m | 7.9% | 42.9% |
| 167 | Palau |
$37m | 7.5% | 33.7% |
| 168 | Saint Vincent and the Grenadines |
$34m | 7.5% | 32.9% |
| 169 | Comoros |
$31m | 9.1% | 0.2% |
| 170 | Tonga |
$25m | 8.9% | 11.1% |
| 171 | Grenada |
$19m | 2.9% | 38.7% |
| 172 | San Marino est. |
$19m | 2.4% | 14.4% |
| 173 | Tuvalu est. |
$1m | 1.8% | · |
Why they rank where they do
-
North Korea
The IMF's figure for North Korea is an estimate. South Korea's trade agency, KOTRA, which tracks North Korea's trade, puts China at 98.2% of North Korea's recorded trade in 2025. UN Security Council resolutions in 2017 banned most North Korean exports.
-
Mongolia
China took about 89% of Mongolia's exports in 2025. Most of what Mongolia sends to China is coal and copper.
-
DR Congo
DR Congo mined 73% of the world's cobalt in 2025, and Chinese companies own or finance most of its cobalt mines.
-
Chile
Chile signed a free trade agreement with China on November 18, 2005, China's first with a Latin American country. China took 90.8% of Chile's fresh cherry exports in the 2024-25 season.
-
Australia
After Australia called for an inquiry into the origins of COVID-19 on April 19, 2020, China restricted imports of Australian barley, beef, coal, wine and lobster. China lifted the last restriction, on lobster, on December 20, 2024.
-
Vietnam
Vietnam's trade grew with both powers. China's share rose from 20.4% in 2015, and the US share rose from 12.7%.
-
Brazil
China has been Brazil's largest trading partner since 2009 and in 2025 bought about three-quarters of Brazil's record soybean exports. China bought no US soybeans for about five months in 2025, until the Busan truce.
-
Russia
Trade between Russia and China reached about $245 billion in 2024 and fell 6.9% to $228.1 billion in 2025. Russia's finance minister said in November 2025 that 99.1% of payments between Russia and China are in rubles and yuan.
-
Japan
China is Japan's largest trading partner in goods, but the United States is Japan's largest export market.
-
Taiwan
In 2025 Taiwan's exports rose 34.9% to $640.75 billion, driven by artificial intelligence hardware. The United States passed mainland China and Hong Kong together as Taiwan's largest export market, for the first time since 2000.
-
India
The United States was India's largest trading partner in the year to March 2025. China overtook the United States in the year to March 2026, with $151.1 billion, and India's trade deficit with China reached a record $112.16 billion.
-
Mexico
In 2023 the United States imported more from Mexico than from China, for the first time since 2002. Mexico was the largest US trading partner in goods in 2025, with $871.6 billion of trade.
-
United States
President Trump's extra tariffs on Chinese goods peaked at 145% in April 2025, and US imports from China fell 29.9% that year. On February 20, 2026, the US Supreme Court ruled that the law he had used does not allow tariffs, and those tariffs ended four days later.
-
Germany
China was Germany's largest trading partner from 2016 to 2023, the United States in 2024, and China again in 2025. Destatis, Germany's statistics office, put China's total at €251.8 billion against €240.5 billion for the United States.
How many countries trade more with China than with the US?
123 of 164 countries with both figures traded more with China than with the United States in 2025. 40 traded more with the United States, and India traded exactly as much with each, at 11.9%. In 90 countries China's share was at least twice the US share.
The 40 are mostly in the Americas and Europe: Canada, Mexico, most of Central America and the Caribbean, and much of Western Europe, including the United Kingdom, Germany, France and Italy. Israel, Georgia, Taiwan and some Pacific islands also trade more with the United States. In 2015, 117 of 166 countries traded more with China and 49 with the United States. Eleven countries switched from the United States to China, including Denmark, Iceland and Côte d'Ivoire. Georgia and Luxembourg switched the other way. The Lowy Institute found that in 2001 more than 80% of countries traded more with the United States than with China.
Which countries depend most on trade with the US?
The United States made up 59.7% of Mexico's trade in 2025, the highest share of any country, and 58.7% of Canada's. The Dominican Republic followed at 44.7%, then Antigua and Barbuda at 42.9%, Costa Rica at 42.0%, Belize at 39.1%, Grenada at 38.7% and Jamaica at 38.4%.
Mexico's US share fell from 63.4% in 2015, and Canada's from 64.4%, but both still rely on the United States for more than half their trade. Ireland's US share was 33.0%, the highest in Europe, and Switzerland's was next at 17.7%. Vietnam's US share rose from 12.7% in 2015 to 19.3% in 2025, and South Korea's from 11.9% to 14.7%. Saudi Arabia's fell from 11.2% to 6.1%.
- Mexico59.7%
- Canada58.7%
- Dominican Republic44.7%
- Antigua and Barbuda42.9%
- Costa Rica42.0%
- Belize39.1%
- Grenada38.7%
- Jamaica38.4%
Who are China's biggest trading partners?
The United States is China's largest trading partner. The US reported $501.5 billion of trade with China in 2025, down from $620.1 billion in 2015. Japan was second at $303.8 billion, then South Korea at $272.5 billion, Vietnam at $255.4 billion, Germany at $207.7 billion, Australia at $198.3 billion, Taiwan at $191.8 billion and Brazil at $175.1 billion.
China's exports were $3.77 trillion and its imports $2.58 trillion in 2025. China's trade surplus was a record $1.19 trillion, the first time above $1 trillion. China reported $562.2 billion of trade with the United States, 8.8% of China's trade, down from 14.3% in 2015. Xi Jinping proposed the Belt and Road Initiative in 2013, and China says more than 150 countries have signed agreements. Italy left in 2023 and Panama in 2025.
- United States$501bn
- Japan$304bn
- South Korea$273bn
- Vietnam$255bn
- Germany$208bn
- Australia$198bn
- Taiwan$192bn
- Brazil$175bn
Why are Iran and Venezuela missing from this ranking?
China bought about 1.38 million barrels a day of Iranian oil in 2025, more than 80% of Iran's crude exports. Chinese customs recorded none of it. The oil is relabeled, mainly as Malaysian. China also bought about 389,000 barrels a day of Venezuelan oil, while its customs recorded under 7,000. The main buyers are small independent refineries in Shandong province.
Oman and Kuwait are left out because their trade figures list most oil exports under no partner country. Guinea, Sierra Leone, Kyrgyzstan, Vanuatu, Haiti, the Bahamas, Nicaragua and Saint Kitts and Nevis are left out because China or the United States reports buying more from them than they report exporting to all partners.