
Ranking · Economy
National debt by country
Venezuela has the highest national debt relative to its economy, 309% of GDP by a rough IMF estimate. Japan is second at 207%. In dollars, the United States owes the most, $38.1 trillion, followed by China with $19.5 trillion. Together, the 186 countries in this ranking owe $110.7 trillion.
Who owes the world's $110.7 trillion of government debt
Share of the government debt of the 186 countries listed, 2025
 United States 34%
 18%
8%
Everyone else 32%
18%
8%
Everyone else 32%
- United States $38.1tn
- China $19.5tn
- Japan $9.16tn
- United Kingdom $4.10tn
- France $3.91tn
- Everyone else $36.0tn
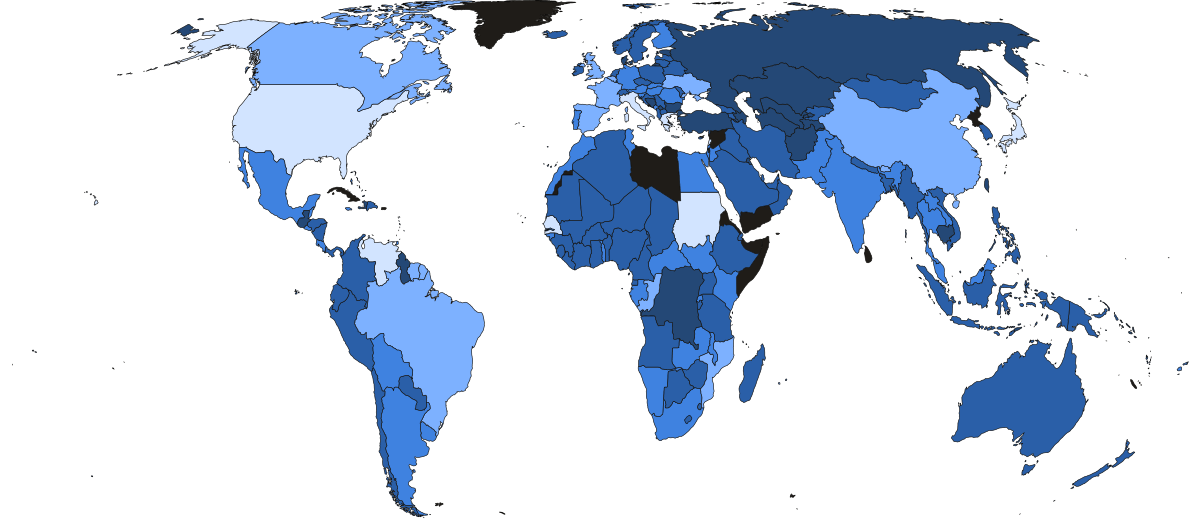
- Under 30%
- 30%–60%
- 60%–90%
- 90%–120%
- Over 120%
- Not in this ranking
- Under $10bn
- $10bn–$100bn
- $100bn–$500bn
- $500bn–$2tn
- Over $2tn
- Not in this ranking
| # | Country | Debt to GDP | In dollars |
|---|---|---|---|
| 1 |  Venezuela est. Venezuela est. |
308.7% | $308bn |
| 2 |  Japan Japan |
206.5% | $9.16tn |
| 3 |  Sudan est. Sudan est. |
187.6% | $74.5bn |
| 4 |  Singapore Singapore |
171.3% | $1.03tn |
| 5 |  Bahrain Bahrain |
147.6% | $70.2bn |
| 6 |  Greece Greece |
145.7% | $409bn |
| 7 |  Lebanon est. Lebanon est. |
139.4% | $48.1bn |
| 8 |  Italy Italy |
137.1% | $3.50tn |
| 9 |  Senegal Senegal |
130.2% | $48.3bn |
| 10 |  Maldives Maldives |
125.4% | $9.6bn |
| 11 | United States |
123.9% | $38.1tn |
| 12 |  France France |
116.0% | $3.91tn |
| 13 |  Canada Canada |
113.5% | $2.63tn |
| 14 |  Saint Vincent and the Grenadines Saint Vincent and the Grenadines |
113.4% | $1.3bn |
| 15 |  Ukraine Ukraine |
108.7% | $232bn |
| 16 |  Belgium Belgium |
106.3% | $771bn |
| 17 |  Suriname Suriname |
105.8% | $4.9bn |
| 18 |  Bhutan Bhutan |
103.6% | $3.6bn |
| 19 |  Dominica Dominica |
102.6% | $800m |
| 20 |  Mozambique Mozambique |
102.5% | $22.9bn |
| 21 |  United Kingdom United Kingdom |
102.3% | $4.10tn |
| 22 |  Cape Verde Cape Verde |
101.0% | $3.1bn |
| 23 |  Spain Spain |
100.4% | $1.91tn |
| 24 | China |
99.2% | $19.5tn |
| 25 |  Republic of the Congo Republic of the Congo |
96.8% | $15.1bn |
| 26 |  Barbados Barbados |
94.2% | $7.6bn |
| 27 |  Brazil Brazil |
93.3% | $2.13tn |
| 28 |  Portugal Portugal |
89.9% | $311bn |
| 29 |  Finland Finland |
89.3% | $283bn |
| 30 |  El Salvador El Salvador |
87.2% | $32.5bn |
| 31 |  Egypt Egypt |
86.8% | $317bn |
| 32 |  Mauritius Mauritius |
86.5% | $13.9bn |
| 33 |  Zambia Zambia |
86.0% | $24.8bn |
| 34 |  Bolivia Bolivia |
84.8% | $54.5bn |
| 35 |  Trinidad and Tobago Trinidad and Tobago |
84.2% | $21.8bn |
| 36 |  India India |
84.1% | $3.29tn |
| 37 |  Jordan Jordan |
82.8% | $51.1bn |
| 38 |  Tunisia Tunisia |
81.3% | $46.8bn |
| 39 |  Laos Laos |
80.6% | $14.4bn |
| 40 |  Austria Austria |
80.5% | $467bn |
| 41 |  Argentina Argentina |
80.3% | $547bn |
| 42 |  Gabon Gabon |
78.9% | $17.1bn |
| 43 |  Fiji Fiji |
78.7% | $4.8bn |
| 44 |  South Africa South Africa |
78.6% | $336bn |
| 45 |  Malawi Malawi |
78.4% | $11.8bn |
| 46 |  Saint Lucia Saint Lucia |
77.1% | $2.0bn |
| 47 |  Guinea-Bissau Guinea-Bissau |
75.3% | $2.0bn |
| 48 |  Hungary Hungary |
75.2% | $186bn |
| 49 |  Gambia Gambia |
73.9% | $1.9bn |
| 50 |  Bahamas Bahamas |
73.8% | $12.2bn |
| 51 |  Pakistan Pakistan |
72.8% | $297bn |
| 52 |  Grenada Grenada |
71.6% | $1.0bn |
| 53 |  Malaysia Malaysia |
70.7% | $334bn |
| 54 |  Namibia Namibia |
70.2% | $10.4bn |
| 55 |  Antigua and Barbuda Antigua and Barbuda |
69.7% | $1.6bn |
| 56 |  Kenya Kenya |
69.3% | $94.6bn |
| 57 |  Israel Israel |
68.5% | $418bn |
| 58 |  Belize Belize |
67.9% | $2.3bn |
| 59 |  Jamaica Jamaica |
67.7% | $15.1bn |
| 60 |  Montenegro Montenegro |
67.1% | $6.2bn |
| 61 |  Morocco Morocco |
67.1% | $123bn |
| 62 |  Slovenia Slovenia |
65.9% | $52.5bn |
| 63 |  Uruguay Uruguay |
65.7% | $56.2bn |
| 64 |  Thailand Thailand |
64.7% | $373bn |
| 65 |  Rwanda Rwanda |
64.6% | $10.3bn |
| 66 |  Togo Togo |
63.0% | $7.5bn |
| 67 |  Germany Germany |
62.9% | $3.18tn |
| 68 |  Palau Palau |
62.3% | $200m |
| 69 |  South Sudan South Sudan |
62.1% | $3.6bn |
| 70 |  Central African Republic Central African Republic |
61.8% | $2.0bn |
| 71 |  Mexico Mexico |
61.8% | $1.13tn |
| 72 |  Slovakia Slovakia |
61.6% | $95.1bn |
| 73 |  Romania Romania |
60.6% | $259bn |
| 74 |  San Marino San Marino |
60.6% | $1.4bn |
| 75 |  Costa Rica Costa Rica |
60.4% | $62.2bn |
| 76 |  Colombia Colombia |
59.9% | $274bn |
| 77 |  Philippines Philippines |
59.4% | $289bn |
| 78 |  Dominican Republic Dominican Republic |
59.0% | $75.5bn |
| 79 |  Poland Poland |
58.8% | $609bn |
| 80 |  Saint Kitts and Nevis Saint Kitts and Nevis |
58.4% | $600m |
| 81 |  Benin Benin |
57.3% | $14.0bn |
| 82 |  Panama Panama |
56.6% | $51.2bn |
| 83 |  Côte d'Ivoire Côte d'Ivoire |
56.3% | $55.7bn |
| 84 |  Iceland Iceland |
56.1% | $21.6bn |
| 85 |  Croatia Croatia |
55.9% | $59.3bn |
| 86 |  São Tomé and Príncipe São Tomé and Príncipe |
55.7% | $500m |
| 87 |  Cyprus Cyprus |
55.3% | $22.7bn |
| 88 |  Liberia Liberia |
54.9% | $2.9bn |
| 89 |  New Zealand New Zealand |
54.7% | $142bn |
| 90 |  Ecuador Ecuador |
54.4% | $70.9bn |
| 91 |  Uganda Uganda |
54.2% | $35.8bn |
| 92 |  Algeria Algeria |
54.1% | $155bn |
| 93 |  Iraq Iraq |
53.9% | $142bn |
| 94 |  Albania Albania |
52.6% | $15.9bn |
| 95 |  North Macedonia North Macedonia |
52.5% | $10.0bn |
| 96 |  South Korea South Korea |
52.3% | $979bn |
| 97 |  Papua New Guinea Papua New Guinea |
52.1% | $16.9bn |
| 98 |  Burkina Faso Burkina Faso |
52.0% | $14.1bn |
| 99 |  Myanmar Myanmar |
51.9% | $42.8bn |
| 100 |  Seychelles Seychelles |
51.5% | $1.2bn |
| 101 |  Angola Angola |
51.3% | $72.7bn |
| 102 |  Australia Australia |
51.0% | $938bn |
| 103 |  Tanzania Tanzania |
49.7% | $43.4bn |
| 104 |  Lesotho Lesotho |
49.1% | $1.4bn |
| 105 |  Armenia Armenia |
49.0% | $14.3bn |
| 106 |  Ghana Ghana |
48.8% | $56.0bn |
| 107 |  Madagascar Madagascar |
48.7% | $9.5bn |
| 108 |  Guinea Guinea |
48.1% | $13.1bn |
| 109 |  Nepal Nepal |
48.1% | $21.6bn |
| 110 |  Latvia Latvia |
46.9% | $22.8bn |
| 111 |  Malta Malta |
46.8% | $13.0bn |
| 112 |  Niger Niger |
45.4% | $9.9bn |
| 113 |  Sierra Leone Sierra Leone |
45.2% | $3.5bn |
| 114 |  Mongolia Mongolia |
45.1% | $11.4bn |
| 115 |  Norway Norway |
45.0% | $239bn |
| 116 |  Eswatini Eswatini |
44.9% | $2.3bn |
| 117 |  Czechia Czechia |
44.6% | $174bn |
| 118 |  Zimbabwe Zimbabwe |
43.8% | $23.4bn |
| 119 |  Netherlands Netherlands |
43.3% | $577bn |
| 120 |  Ethiopia Ethiopia |
43.1% | $47.0bn |
| 121 |  Serbia Serbia |
42.4% | $42.4bn |
| 122 |  Bangladesh Bangladesh |
42.0% | $192bn |
| 123 |  Mali Mali |
41.9% | $12.6bn |
| 124 |  Chile Chile |
41.8% | $149bn |
| 125 |  Qatar Qatar |
41.4% | $91.6bn |
| 126 |  Burundi Burundi |
41.2% | $2.9bn |
| 127 |  Honduras Honduras |
41.2% | $16.4bn |
| 128 |  Indonesia Indonesia |
41.0% | $593bn |
| 129 |  Vanuatu Vanuatu |
40.9% | $500m |
| 130 |  Equatorial Guinea Equatorial Guinea |
40.6% | $5.1bn |
| 131 |  Cameroon Cameroon |
40.4% | $23.9bn |
| 132 |  Mauritania Mauritania |
40.1% | $4.9bn |
| 133 |  Lithuania Lithuania |
39.8% | $37.8bn |
| 134 |  Switzerland Switzerland |
39.4% | $411bn |
| 135 |  Botswana Botswana |
38.6% | $7.5bn |
| 136 |  Paraguay Paraguay |
38.1% | $18.8bn |
| 137 |  Iran Iran |
37.3% | $139bn |
| 138 |  Moldova Moldova |
36.6% | $7.4bn |
| 139 |  Kyrgyzstan Kyrgyzstan |
36.0% | $7.8bn |
| 140 |  Oman Oman |
35.8% | $38.0bn |
| 141 |  Nigeria Nigeria |
35.5% | $103bn |
| 142 |  Sweden Sweden |
34.9% | $234bn |
| 143 |  Nicaragua Nicaragua |
34.8% | $7.7bn |
| 144 |  Georgia Georgia |
34.3% | $13.1bn |
| 145 |  United Arab Emirates United Arab Emirates |
34.3% | $196bn |
| 146 |  Belarus Belarus |
33.1% | $30.7bn |
| 147 |  Ireland Ireland |
32.9% | $236bn |
| 148 |  Djibouti Djibouti |
32.1% | $1.4bn |
| 149 |  Saudi Arabia Saudi Arabia |
31.7% | $405bn |
| 150 |  Chad Chad |
30.4% | $6.7bn |
| 151 |  Andorra Andorra |
30.3% | $1.4bn |
| 152 |  Vietnam Vietnam |
30.3% | $150bn |
| 153 |  Peru Peru |
30.2% | $103bn |
| 154 |  Bosnia and Herzegovina Bosnia and Herzegovina |
29.9% | $9.9bn |
| 155 |  Comoros Comoros |
29.5% | $500m |
| 156 |  Solomon Islands Solomon Islands |
28.7% | $500m |
| 157 |  Guyana Guyana |
28.6% | $7.7bn |
| 158 |  Uzbekistan Uzbekistan |
28.6% | $42.1bn |
| 159 |  Denmark Denmark |
27.5% | $127bn |
| 160 |  Tonga Tonga |
27.4% | $200m |
| 161 |  Guatemala Guatemala |
27.2% | $32.9bn |
| 162 |  Bulgaria Bulgaria |
27.1% | $35.5bn |
| 163 |  Luxembourg Luxembourg |
27.0% | $27.3bn |
| 164 |  Cambodia Cambodia |
26.5% | $13.1bn |
| 165 |  Kazakhstan Kazakhstan |
24.6% | $74.5bn |
| 166 |  Estonia Estonia |
24.2% | $11.4bn |
| 167 |  Turkey Turkey |
23.5% | $375bn |
| 168 |  Taiwan Taiwan |
22.4% | $206bn |
| 169 |  Tajikistan Tajikistan |
21.6% | $3.8bn |
| 170 |  Samoa Samoa |
21.2% | $300m |
| 171 |  DR Congo DR Congo |
20.2% | $18.8bn |
| 172 |  Azerbaijan Azerbaijan |
20.1% | $15.3bn |
| 173 |  Kosovo Kosovo |
17.5% | $2.2bn |
| 174 |  Russia Russia |
17.2% | $445bn |
| 175 |  Kuwait Kuwait |
14.6% | $23.0bn |
| 176 |  Nauru Nauru |
14.6% | $0m |
| 177 |  Timor-Leste Timor-Leste |
14.3% | $300m |
| 178 |  Haiti Haiti |
12.3% | $3.9bn |
| 179 |  Marshall Islands Marshall Islands |
11.8% | $0m |
| 180 |  Micronesia Micronesia |
8.9% | $0m |
| 181 |  Afghanistan Afghanistan |
8.0% | $1.6bn |
| 182 |  Kiribati Kiribati |
8.0% | $0m |
| 183 |  Turkmenistan Turkmenistan |
3.8% | $2.9bn |
| 184 |  Tuvalu Tuvalu |
3.6% | $0m |
| 185 |  Brunei Brunei |
1.5% | $200m |
| 186 |  Liechtenstein Liechtenstein |
0.5% | $0m |
| # | Country | In dollars | Debt to GDP |
|---|---|---|---|
| 1 | United States |
$38.1tn | 123.9% |
| 2 | China |
$19.5tn | 99.2% |
| 3 | Japan |
$9.16tn | 206.5% |
| 4 | United Kingdom |
$4.10tn | 102.3% |
| 5 | France |
$3.91tn | 116.0% |
| 6 | Italy |
$3.50tn | 137.1% |
| 7 | India |
$3.29tn | 84.1% |
| 8 | Germany |
$3.18tn | 62.9% |
| 9 | Canada |
$2.63tn | 113.5% |
| 10 | Brazil |
$2.13tn | 93.3% |
| 11 | Spain |
$1.91tn | 100.4% |
| 12 | Mexico |
$1.13tn | 61.8% |
| 13 | Singapore |
$1.03tn | 171.3% |
| 14 | South Korea |
$979bn | 52.3% |
| 15 | Australia |
$938bn | 51.0% |
| 16 | Belgium |
$771bn | 106.3% |
| 17 | Poland |
$609bn | 58.8% |
| 18 | Indonesia |
$593bn | 41.0% |
| 19 | Netherlands |
$577bn | 43.3% |
| 20 | Argentina |
$547bn | 80.3% |
| 21 | Austria |
$467bn | 80.5% |
| 22 | Russia |
$445bn | 17.2% |
| 23 | Israel |
$418bn | 68.5% |
| 24 | Switzerland |
$411bn | 39.4% |
| 25 | Greece |
$409bn | 145.7% |
| 26 | Saudi Arabia |
$405bn | 31.7% |
| 27 | Turkey |
$375bn | 23.5% |
| 28 | Thailand |
$373bn | 64.7% |
| 29 | South Africa |
$336bn | 78.6% |
| 30 | Malaysia |
$334bn | 70.7% |
| 31 | Egypt |
$317bn | 86.8% |
| 32 | Portugal |
$311bn | 89.9% |
| 33 | Venezuela est. |
$308bn | 308.7% |
| 34 | Pakistan |
$297bn | 72.8% |
| 35 | Philippines |
$289bn | 59.4% |
| 36 | Finland |
$283bn | 89.3% |
| 37 | Colombia |
$274bn | 59.9% |
| 38 | Romania |
$259bn | 60.6% |
| 39 | Norway |
$239bn | 45.0% |
| 40 | Ireland |
$236bn | 32.9% |
| 41 | Sweden |
$234bn | 34.9% |
| 42 | Ukraine |
$232bn | 108.7% |
| 43 | Taiwan |
$206bn | 22.4% |
| 44 | United Arab Emirates |
$196bn | 34.3% |
| 45 | Bangladesh |
$192bn | 42.0% |
| 46 | Hungary |
$186bn | 75.2% |
| 47 | Czechia |
$174bn | 44.6% |
| 48 | Algeria |
$155bn | 54.1% |
| 49 | Vietnam |
$150bn | 30.3% |
| 50 | Chile |
$149bn | 41.8% |
| 51 | Iraq |
$142bn | 53.9% |
| 52 | New Zealand |
$142bn | 54.7% |
| 53 | Iran |
$139bn | 37.3% |
| 54 | Denmark |
$127bn | 27.5% |
| 55 | Morocco |
$123bn | 67.1% |
| 56 | Nigeria |
$103bn | 35.5% |
| 57 | Peru |
$103bn | 30.2% |
| 58 | Slovakia |
$95.1bn | 61.6% |
| 59 | Kenya |
$94.6bn | 69.3% |
| 60 | Qatar |
$91.6bn | 41.4% |
| 61 | Dominican Republic |
$75.5bn | 59.0% |
| 62 | Sudan est. |
$74.5bn | 187.6% |
| 63 | Kazakhstan |
$74.5bn | 24.6% |
| 64 | Angola |
$72.7bn | 51.3% |
| 65 | Ecuador |
$70.9bn | 54.4% |
| 66 | Bahrain |
$70.2bn | 147.6% |
| 67 | Costa Rica |
$62.2bn | 60.4% |
| 68 | Croatia |
$59.3bn | 55.9% |
| 69 | Uruguay |
$56.2bn | 65.7% |
| 70 | Ghana |
$56.0bn | 48.8% |
| 71 | Côte d'Ivoire |
$55.7bn | 56.3% |
| 72 | Bolivia |
$54.5bn | 84.8% |
| 73 | Slovenia |
$52.5bn | 65.9% |
| 74 | Panama |
$51.2bn | 56.6% |
| 75 | Jordan |
$51.1bn | 82.8% |
| 76 | Senegal |
$48.3bn | 130.2% |
| 77 | Lebanon est. |
$48.1bn | 139.4% |
| 78 | Ethiopia |
$47.0bn | 43.1% |
| 79 | Tunisia |
$46.8bn | 81.3% |
| 80 | Tanzania |
$43.4bn | 49.7% |
| 81 | Myanmar |
$42.8bn | 51.9% |
| 82 | Serbia |
$42.4bn | 42.4% |
| 83 | Uzbekistan |
$42.1bn | 28.6% |
| 84 | Oman |
$38.0bn | 35.8% |
| 85 | Lithuania |
$37.8bn | 39.8% |
| 86 | Uganda |
$35.8bn | 54.2% |
| 87 | Bulgaria |
$35.5bn | 27.1% |
| 88 | Guatemala |
$32.9bn | 27.2% |
| 89 | El Salvador |
$32.5bn | 87.2% |
| 90 | Belarus |
$30.7bn | 33.1% |
| 91 | Luxembourg |
$27.3bn | 27.0% |
| 92 | Zambia |
$24.8bn | 86.0% |
| 93 | Cameroon |
$23.9bn | 40.4% |
| 94 | Zimbabwe |
$23.4bn | 43.8% |
| 95 | Kuwait |
$23.0bn | 14.6% |
| 96 | Mozambique |
$22.9bn | 102.5% |
| 97 | Latvia |
$22.8bn | 46.9% |
| 98 | Cyprus |
$22.7bn | 55.3% |
| 99 | Trinidad and Tobago |
$21.8bn | 84.2% |
| 100 | Iceland |
$21.6bn | 56.1% |
| 101 | Nepal |
$21.6bn | 48.1% |
| 102 | Paraguay |
$18.8bn | 38.1% |
| 103 | DR Congo |
$18.8bn | 20.2% |
| 104 | Gabon |
$17.1bn | 78.9% |
| 105 | Papua New Guinea |
$16.9bn | 52.1% |
| 106 | Honduras |
$16.4bn | 41.2% |
| 107 | Albania |
$15.9bn | 52.6% |
| 108 | Azerbaijan |
$15.3bn | 20.1% |
| 109 | Republic of the Congo |
$15.1bn | 96.8% |
| 110 | Jamaica |
$15.1bn | 67.7% |
| 111 | Laos |
$14.4bn | 80.6% |
| 112 | Armenia |
$14.3bn | 49.0% |
| 113 | Burkina Faso |
$14.1bn | 52.0% |
| 114 | Benin |
$14.0bn | 57.3% |
| 115 | Mauritius |
$13.9bn | 86.5% |
| 116 | Guinea |
$13.1bn | 48.1% |
| 117 | Georgia |
$13.1bn | 34.3% |
| 118 | Cambodia |
$13.1bn | 26.5% |
| 119 | Malta |
$13.0bn | 46.8% |
| 120 | Mali |
$12.6bn | 41.9% |
| 121 | Bahamas |
$12.2bn | 73.8% |
| 122 | Malawi |
$11.8bn | 78.4% |
| 123 | Mongolia |
$11.4bn | 45.1% |
| 124 | Estonia |
$11.4bn | 24.2% |
| 125 | Namibia |
$10.4bn | 70.2% |
| 126 | Rwanda |
$10.3bn | 64.6% |
| 127 | North Macedonia |
$10.0bn | 52.5% |
| 128 | Niger |
$9.9bn | 45.4% |
| 129 | Bosnia and Herzegovina |
$9.9bn | 29.9% |
| 130 | Maldives |
$9.6bn | 125.4% |
| 131 | Madagascar |
$9.5bn | 48.7% |
| 132 | Kyrgyzstan |
$7.8bn | 36.0% |
| 133 | Nicaragua |
$7.7bn | 34.8% |
| 134 | Guyana |
$7.7bn | 28.6% |
| 135 | Barbados |
$7.6bn | 94.2% |
| 136 | Togo |
$7.5bn | 63.0% |
| 137 | Botswana |
$7.5bn | 38.6% |
| 138 | Moldova |
$7.4bn | 36.6% |
| 139 | Chad |
$6.7bn | 30.4% |
| 140 | Montenegro |
$6.2bn | 67.1% |
| 141 | Equatorial Guinea |
$5.1bn | 40.6% |
| 142 | Suriname |
$4.9bn | 105.8% |
| 143 | Mauritania |
$4.9bn | 40.1% |
| 144 | Fiji |
$4.8bn | 78.7% |
| 145 | Haiti |
$3.9bn | 12.3% |
| 146 | Tajikistan |
$3.8bn | 21.6% |
| 147 | Bhutan |
$3.6bn | 103.6% |
| 148 | South Sudan |
$3.6bn | 62.1% |
| 149 | Sierra Leone |
$3.5bn | 45.2% |
| 150 | Cape Verde |
$3.1bn | 101.0% |
| 151 | Liberia |
$2.9bn | 54.9% |
| 152 | Burundi |
$2.9bn | 41.2% |
| 153 | Turkmenistan |
$2.9bn | 3.8% |
| 154 | Belize |
$2.3bn | 67.9% |
| 155 | Eswatini |
$2.3bn | 44.9% |
| 156 | Kosovo |
$2.2bn | 17.5% |
| 157 | Saint Lucia |
$2.0bn | 77.1% |
| 158 | Guinea-Bissau |
$2.0bn | 75.3% |
| 159 | Central African Republic |
$2.0bn | 61.8% |
| 160 | Gambia |
$1.9bn | 73.9% |
| 161 | Antigua and Barbuda |
$1.6bn | 69.7% |
| 162 | Afghanistan |
$1.6bn | 8.0% |
| 163 | San Marino |
$1.4bn | 60.6% |
| 164 | Lesotho |
$1.4bn | 49.1% |
| 165 | Djibouti |
$1.4bn | 32.1% |
| 166 | Andorra |
$1.4bn | 30.3% |
| 167 | Saint Vincent and the Grenadines |
$1.3bn | 113.4% |
| 168 | Seychelles |
$1.2bn | 51.5% |
| 169 | Grenada |
$1.0bn | 71.6% |
| 170 | Dominica |
$800m | 102.6% |
| 171 | Saint Kitts and Nevis |
$600m | 58.4% |
| 172 | São Tomé and Príncipe |
$500m | 55.7% |
| 173 | Vanuatu |
$500m | 40.9% |
| 174 | Comoros |
$500m | 29.5% |
| 175 | Solomon Islands |
$500m | 28.7% |
| 176 | Samoa |
$300m | 21.2% |
| 177 | Timor-Leste |
$300m | 14.3% |
| 178 | Palau |
$200m | 62.3% |
| 179 | Tonga |
$200m | 27.4% |
| 180 | Brunei |
$200m | 1.5% |
| 181 | Nauru |
$0m | 14.6% |
| 182 | Marshall Islands |
$0m | 11.8% |
| 183 | Micronesia |
$0m | 8.9% |
| 184 | Kiribati |
$0m | 8.0% |
| 185 | Tuvalu |
$0m | 3.6% |
| 186 | Liechtenstein |
$0m | 0.5% |
Why they rank where they do
-
Venezuela
Venezuela and its state oil company PDVSA stopped paying their bondholders in November 2017. After US forces captured Nicolás Maduro on January 3, 2026, the government in Caracas announced a plan to restructure debts estimated at $150 billion to $170 billion. As of September 2026 there is no deal, and US sanctions still limit the talks.
-
Japan
Japan's government debt was 55% of GDP in 1990, before its stock and property bubble burst. It peaked at 229% in 2020.
-
Sudan
Sudan has been at war since April 2023, when fighting broke out between the army and the paramilitary Rapid Support Forces. Its economy has collapsed.
-
Singapore
Singapore's Ministry of Finance says the government "does not borrow for recurrent spending needs." By law, almost all of its borrowing cannot be spent and is invested instead. Most of it is special bonds that hold the savings of the Central Provident Fund, Singapore's national pension savings system.
-
Bahrain
Bahrain is a small Gulf oil producer with much less oil than its neighbors. In 2018 Saudi Arabia, the United Arab Emirates and Kuwait pledged $10 billion to help Bahrain pay its bills.
-
Greece
The eurozone debt crisis began in Greece. Three bailouts, in 2010, 2012 and 2015, paid out €288.7 billion. In 2012 private bondholders accepted a 53.5% cut in the face value of about €197 billion of Greek bonds, the largest sovereign debt restructuring on record. Greece's debt has fallen from 210% of GDP in 2020, and Greece repaid the IMF early, in April 2022.
-
Lebanon
On March 7, 2020, Lebanon said it would not repay a $1.2 billion bond, its first default ever. All of its roughly $31 billion of foreign bonds went into default. The Lebanese pound has lost about 98% of its value, and as of September 2026 there is still no deal with creditors.
-
Senegal
In September 2024 Senegal's new prime minister, Ousmane Sonko, said the previous government had hidden debt. In February 2025 Senegal's Court of Auditors found that central government debt at the end of 2023 was 99.7% of GDP, not the 74.4% reported. On September 1, 2026, IMF staff agreed a new $2.2 billion loan, which still needs approval by the IMF's board.
-
United States
The US Treasury counts federal debt differently from the IMF, and its count passed $40 trillion on August 18, 2026. US government debt was 65% of GDP in 2007, before the financial crisis.
-
China
The IMF's figure already counts about two-thirds of the debt of local government financing vehicles, companies that local governments set up to borrow off their books. Counting all of it, the IMF puts China's debt at 126.6% of GDP in 2025. In November 2024 China approved a 10 trillion yuan program to swap hidden local government debt for official bonds.
-
Germany
Germany's constitution has had a "debt brake" since 2009. It limits the federal government's structural deficit to 0.35% of GDP. In March 2025 the Bundestag voted to exempt defense spending above 1% of GDP and to create a €500 billion infrastructure fund.
-
Russia
After its 1998 financial crisis and default, Russia kept its borrowing low and saved oil revenue in a national wealth fund. In June 2022 Russia defaulted on its international bonds for the first time since the Bolsheviks repudiated the Tsar's debts in 1918. Russia had the money, but Western sanctions blocked the payments.
Which country has the most debt?
The United States owes $38.1 trillion, more than any other country and more than the next four countries combined: China, Japan, the United Kingdom and France. The US alone owes 34% of the government debt of all 186 countries in this ranking.
The interest bill is growing with it. In fiscal year 2024, US net interest payments ($881.7 billion) were larger than national defense spending ($874.0 billion) for the first time. In fiscal 2025, interest reached $970.4 billion and defense $916.6 billion. On May 16, 2025, Moody's cut the US credit rating from Aaa to Aa1. Moody's was the last of the three big rating agencies to remove the top rating, after S&P in 2011 and Fitch in 2023.
United States$38.1tn
The next 4 together$36.6tn
China, Japan, United Kingdom and France
Why can Japan owe more than twice the size of its economy?
All of Japan's government debt is in yen, a currency Japan issues itself, and nearly 90% of it is held inside Japan. The Bank of Japan alone owns about 47% of Japanese government bonds. For decades, interest rates in Japan stayed near zero, so the debt was cheap to carry. Japan's Ministry of Finance says most of the rise since 1990 came from social security costs for an aging population: about ¥524 trillion of a ¥975 trillion increase in bonds. Public works added about ¥72 trillion.
Now the cost is rising. The Bank of Japan ended negative interest rates in March 2024 and has raised its rate five times since, to 1.25% in September 2026. On September 24, 2026, the 10-year Japanese government bond yield reached 3.07%, its highest since 1996.
Which countries own the most US debt?
Japan is the largest foreign holder of US Treasury securities, with $1.10 trillion in July 2026. The United Kingdom is second with $998 billion, and China third with $618 billion.
China's holdings peaked at $1.32 trillion in November 2013. They have fallen since and are now at their lowest since 2008. The United Kingdom overtook China in March 2025.
Which countries have defaulted on their debt recently?
Recent defaults include Lebanon in March 2020 and Argentina in May 2020, in what was widely reported as Argentina's ninth default. Zambia followed in November 2020. Sri Lanka defaulted in May 2022, its first default since independence, and Russia in June 2022. Ghana defaulted in December 2022 and Ethiopia in December 2023.
Zambia, Sri Lanka, Ghana and Argentina have since completed deals with their bondholders. Venezuela has been in default since November 2017.
Read more
-
 Blog
Why is the yen carry trade unwinding again?
Japan and the US just made their first joint currency intervention since 2011 to defend the yen. Why the carry trade keeps unwinding into market chaos.
Blog
Why is the yen carry trade unwinding again?
Japan and the US just made their first joint currency intervention since 2011 to defend the yen. Why the carry trade keeps unwinding into market chaos.
-
 Blog
Is de-dollarization really happening in 2026?
The dollar's reserve share keeps sliding and central banks are hoarding gold. But real de-dollarization looks nothing like the headlines promise.
Blog
Is de-dollarization really happening in 2026?
The dollar's reserve share keeps sliding and central banks are hoarding gold. But real de-dollarization looks nothing like the headlines promise.