
Resource · Industrial metal
Copper
Copper conducts electricity and heat better than almost any affordable metal, and goes into wiring, pipes, motors and electronics. Chile mines the most copper, producing 23% of the world's 23 million tonnes in 2025. China refines 48% of the world's copper and uses 58% of it. In September 2026 the copper price reached a record $14,875 a tonne.
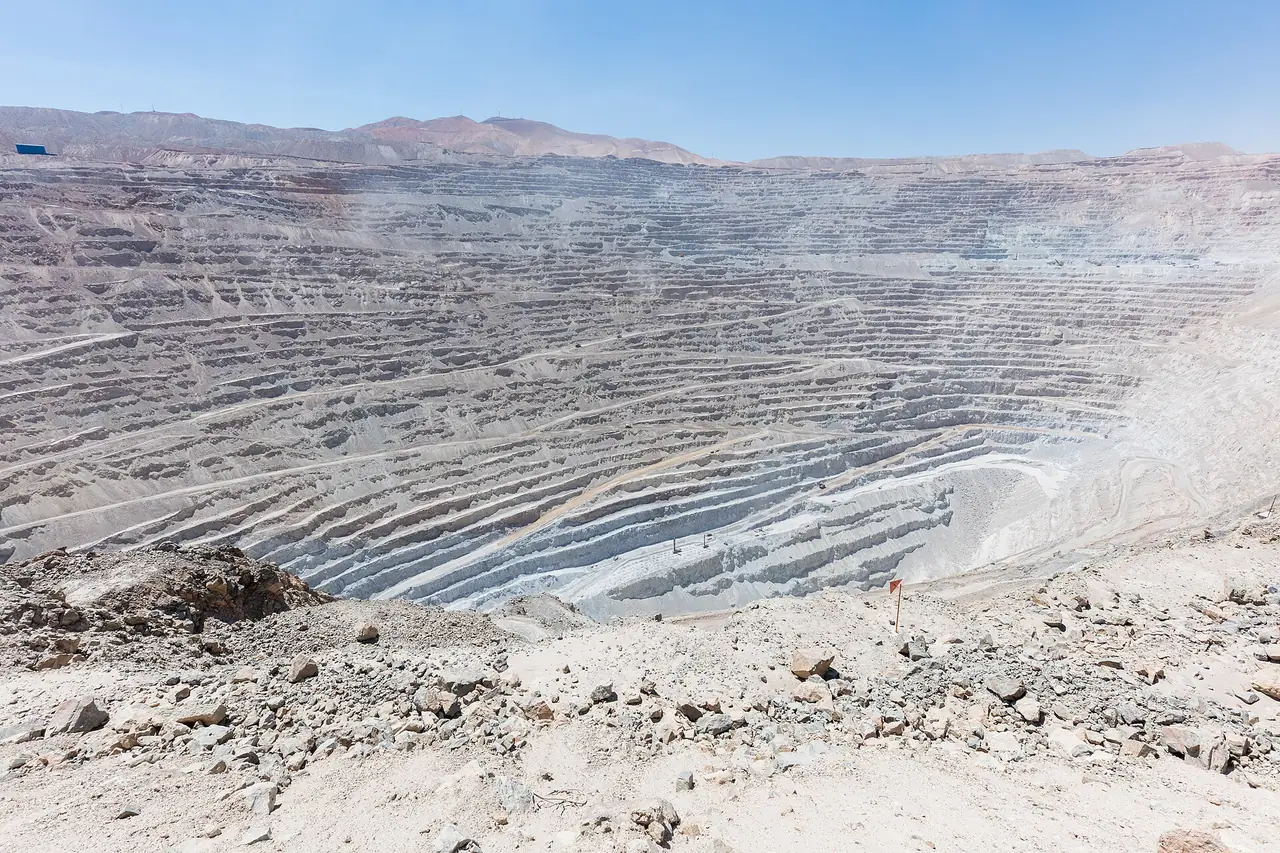
- Mined in 2025
- 23 million t
- of copper
- Largest producer
 5.3M t
- 23% of the world
- Refined in China
- 48%
- 14 million tonnes in 2025
- Used in China
- 58%
- of refined copper, 2024
- Record price
- $14,875
- a tonne, September 10, 2026
Which countries produce the most copper?
Chile is the largest copper miner, producing 23% of world output in 2025. DR Congo ranks second. Chinese-owned mines produce a large share of DR Congo's copper. China's CMOC alone produced 741,100 tonnes in DR Congo in 2025.
Two accidents disrupted supply that year. A mud inrush killed seven workers at Freeport's Grasberg mine in Indonesia in September 2025. A seismic event flooded parts of the Kamoa-Kakula complex in DR Congo in May 2025.
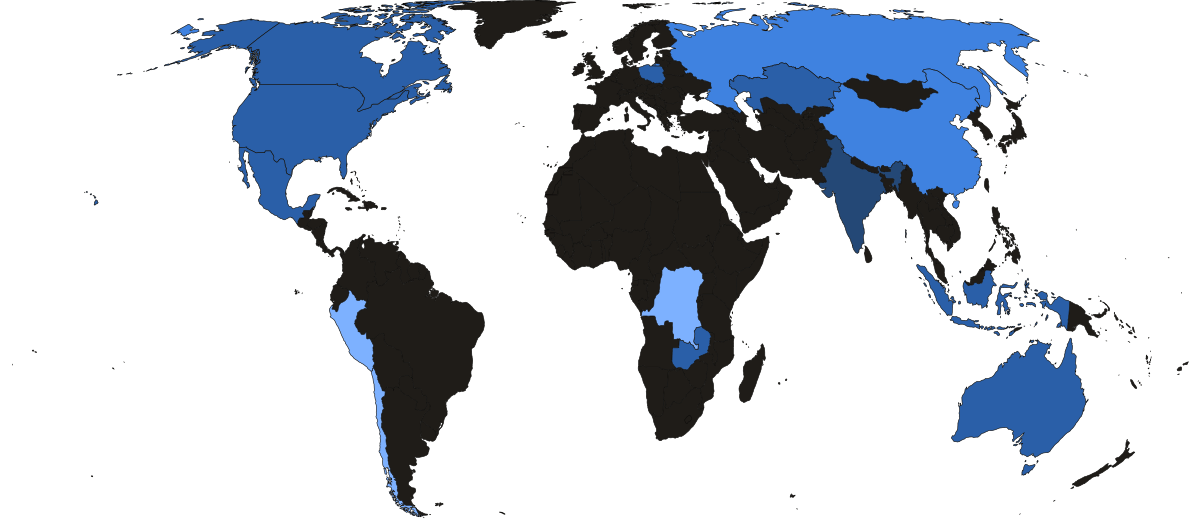
Share of world mine output, 2025
- Chile23.0%
 DR Congo13.9%
 Peru11.7%
 China7.8%
 Russia5.7%
 United States4.3%
- Everyone else33.6%
- Under 1%
- 1%–5%
- 5%–10%
- 10%–25%
- Over 25%
- No production
Who refines copper?
China refines 48% of the world's copper even though China mines only 8%. Chinese smelters process ore shipped from Chile, Peru and other mining countries. DR Congo is the second-largest refiner at 10%, but DR Congo's refined copper is mostly cathode produced directly at mine sites.
China also consumes 58% of the world's refined copper. Much of that copper goes into goods that Chinese factories later export.
From mine to wire
Share of world copper at each step
Chile 23%China 7.8%DR Congo 14%Peru 12%China 48%DR Congo 9.7%Chile 5.9%China 58%What is copper used for?
Building construction is the largest end use, taking 26% of world copper for wiring and plumbing. New demand is growing fastest in three areas: electricity grids being built out for renewable power, electric vehicles, and data centers. BHP estimates that data centers could raise their share of world copper demand from about 1% to as much as 7% by 2050.
The IEA projects that copper supply from existing and announced mines will fall about 25% short of demand by 2035.
What the world's copper goes into
Share of world use, 2024
- Buildings26%
- Consumer goods and electronics23%
- Power and telecom networks17%
- Transport13%
- Industrial equipment12%
- Other9%
How much goes into one
- 83 kgof copper in a battery electric car, against 23 kg in a gasoline car
- 8 tof copper for each megawatt of offshore wind power
- 199 kgof copper in an average American house
- 500,000 tof copper a year goes into data centers
Which country has the most copper reserves?
Chile holds the largest copper reserves, with 18% of the world's 980 million tonnes. Australia ranks second at 10% but mines only 3% of world output. DR Congo has just 8% of reserves yet produces 14% of world copper.
China has 4% of reserves and mines 8%, yet its smelters refine 48% of the world's copper. That is why China depends on ore shipped from Chile, Peru and other mining countries.
Reserves against mining
Share of reservesShare of mining- Chile18%23%
 Australia10%3.2%
- Peru8.7%12%
- DR Congo8.2%14%
- Russia8.2%5.7%
 Mexico5.4%3%
- United States4.8%4.3%
- China4.2%7.8%
Other resources
All 11 resources →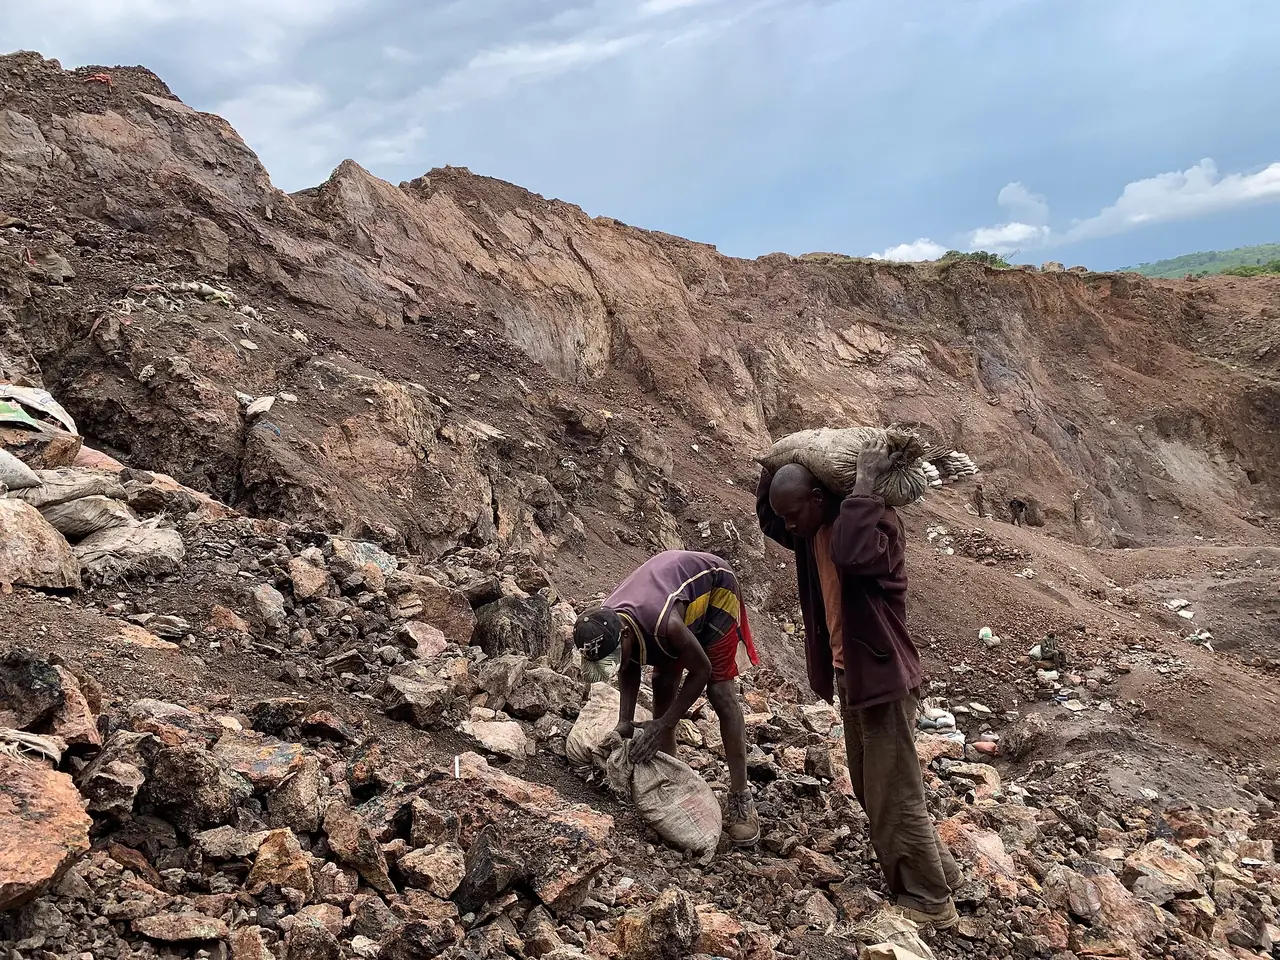 DR Congo 74%
Battery metal
Cobalt
China refines 79% of the world's cobalt but mines less than 1%.
DR Congo 74%
Battery metal
Cobalt
China refines 79% of the world's cobalt but mines less than 1%.
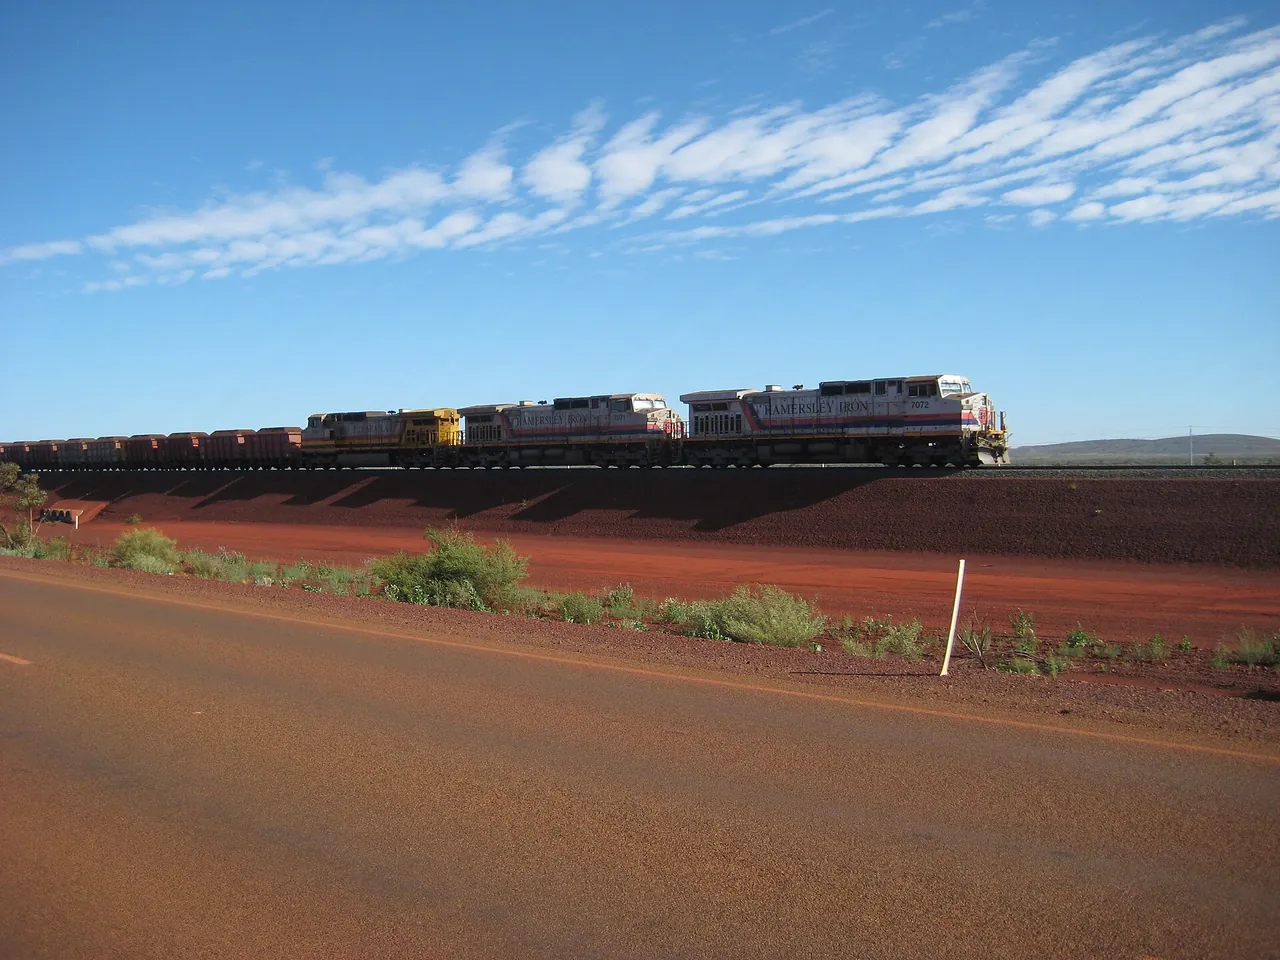 Australia 38%
Industrial metal
Iron ore
China mines 11% of the world's iron ore but buys three quarters of seaborne trade.
Australia 38%
Industrial metal
Iron ore
China mines 11% of the world's iron ore but buys three quarters of seaborne trade.
 Australia 32%
Battery metal
Lithium
China mines 21% of lithium but refines 70% and makes 80% of battery cells.
Australia 32%
Battery metal
Lithium
China mines 21% of lithium but refines 70% and makes 80% of battery cells.