
The world's strategic resources
Eleven raw materials that keep the world economy running, from crude oil and natural gas to lithium, rare earths and wheat. Each page covers which countries produce the resource, who refines it, who uses the most and why it matters for geopolitics.
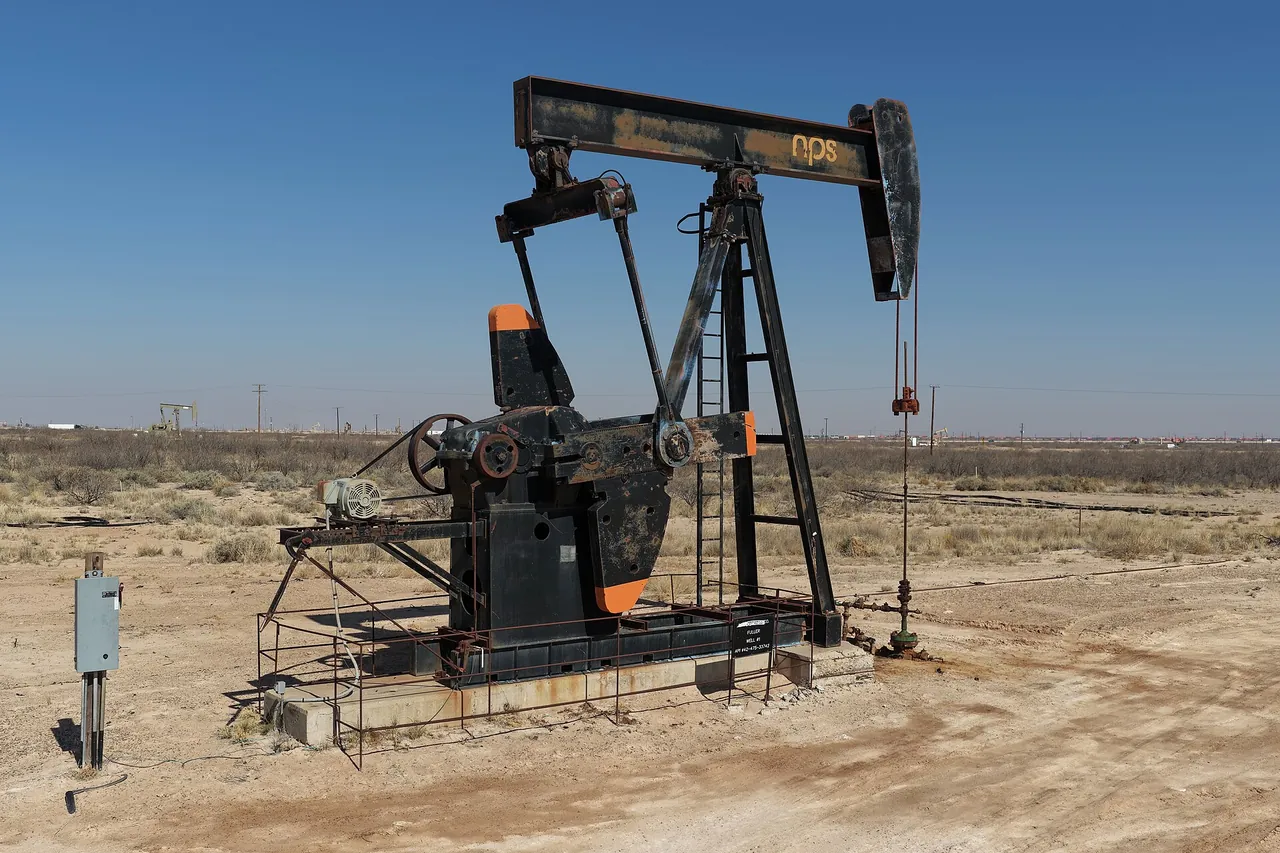
 United States 16.1%
Energy
Crude oil
The US pumps 13.6 million barrels a day, more than any other country.
United States 16.1%
Energy
Crude oil
The US pumps 13.6 million barrels a day, more than any other country.
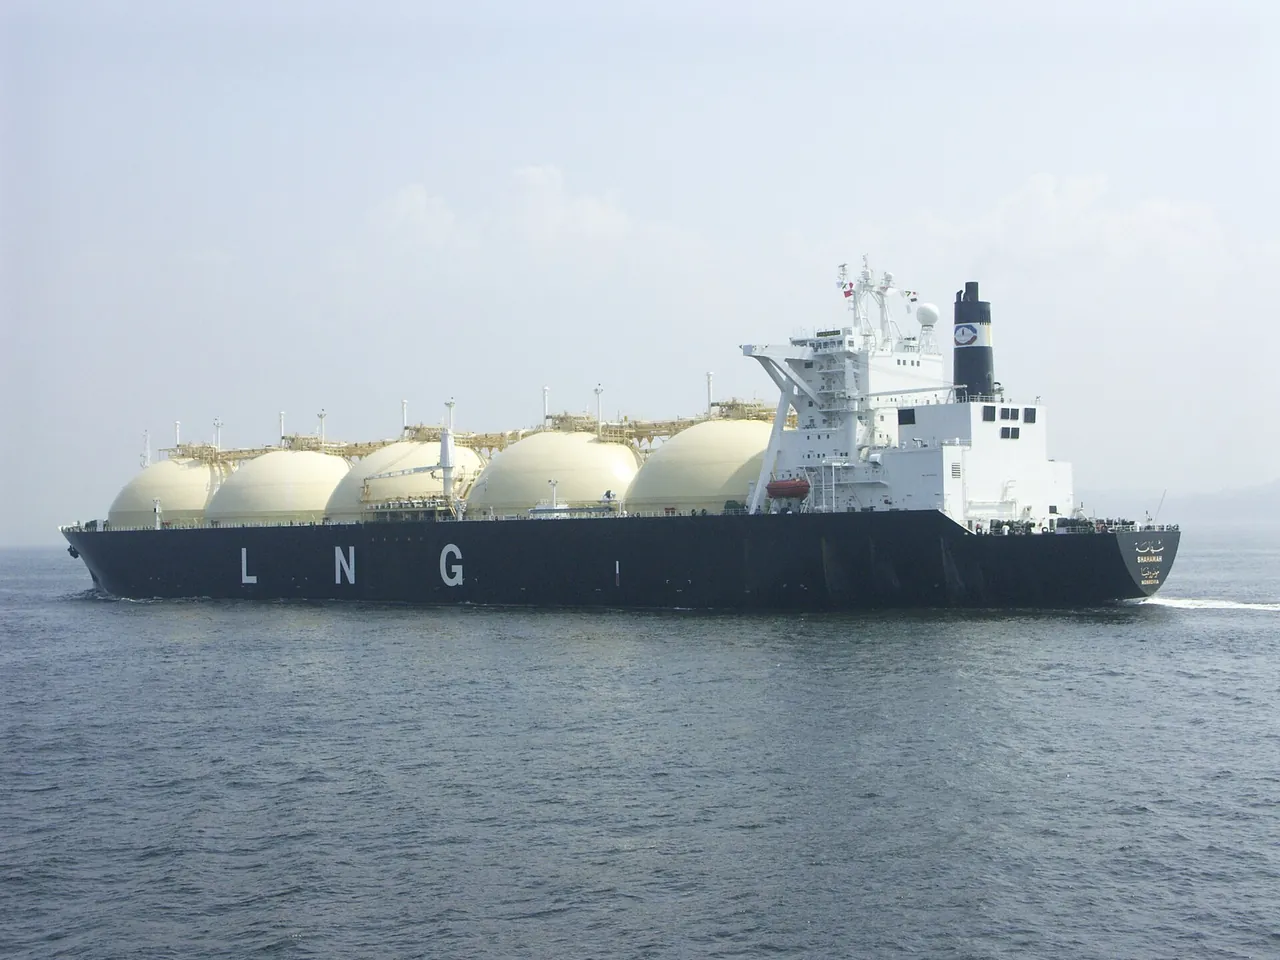 United States 25%
Energy
Natural gas
Qatar's LNG cargoes fell 96% in six months after Iran closed the Strait of Hormuz.
United States 25%
Energy
Natural gas
Qatar's LNG cargoes fell 96% in six months after Iran closed the Strait of Hormuz.
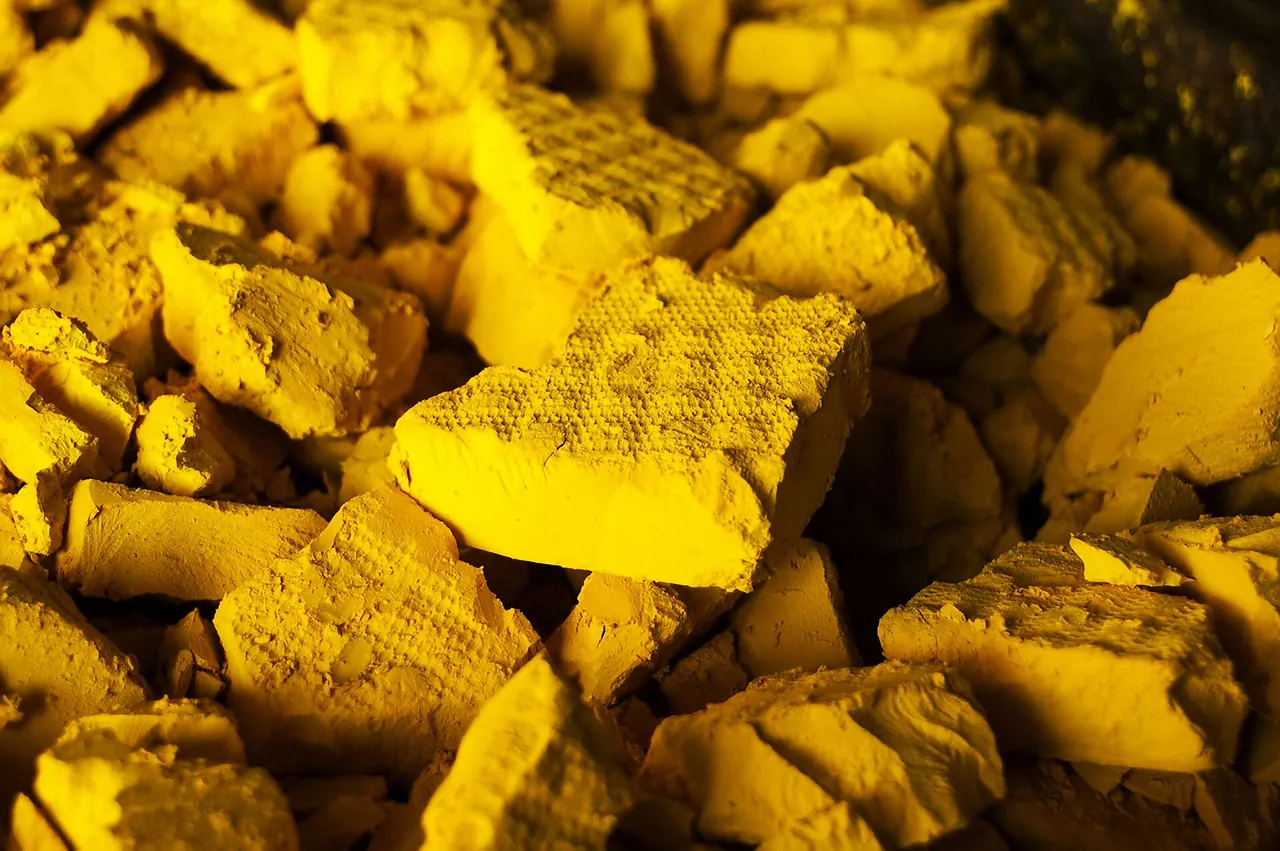
 Kazakhstan 39%
Energy
Uranium
Russia mines under 5% of uranium but holds 43% of world enrichment capacity.
Kazakhstan 39%
Energy
Uranium
Russia mines under 5% of uranium but holds 43% of world enrichment capacity.
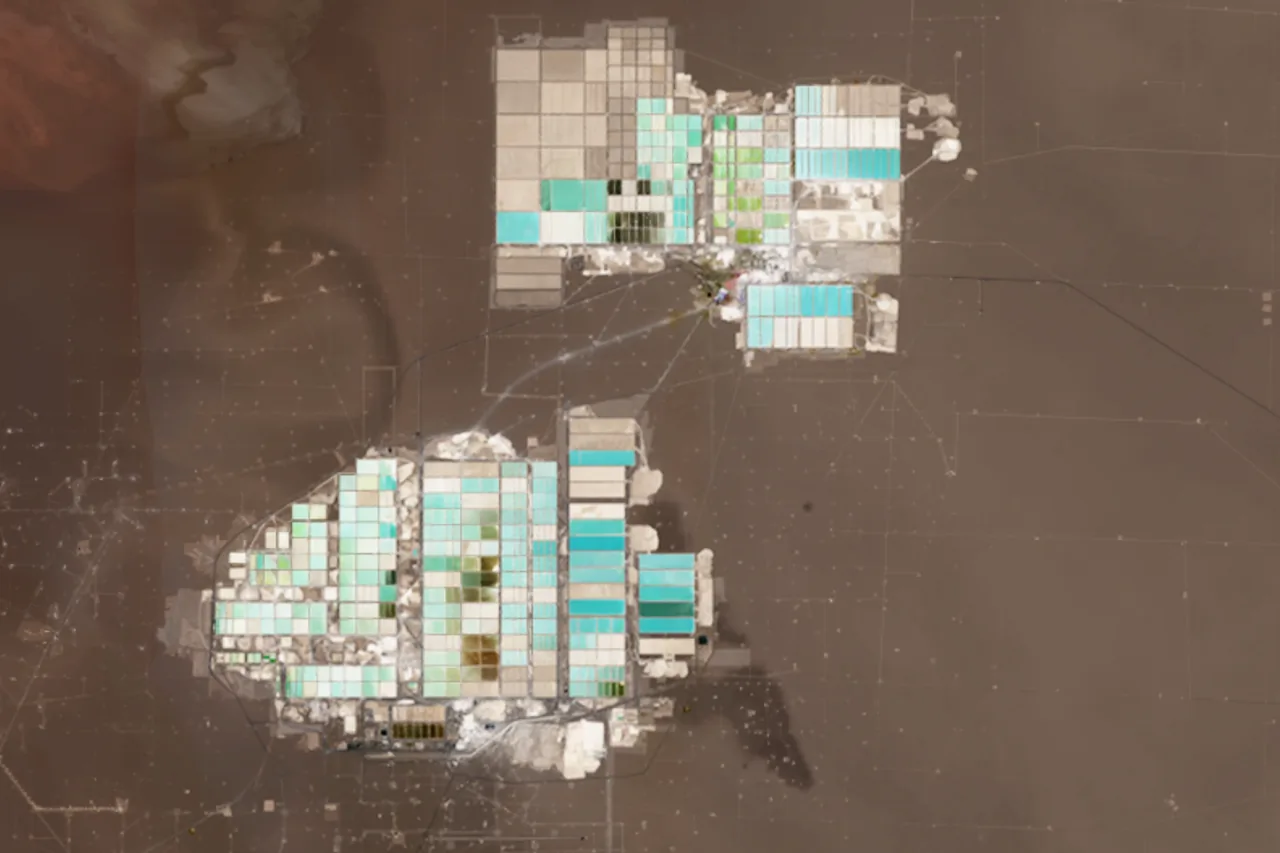
 Australia 32%
Battery metal
Lithium
China mines 21% of lithium but refines 70% and makes 80% of battery cells.
Australia 32%
Battery metal
Lithium
China mines 21% of lithium but refines 70% and makes 80% of battery cells.
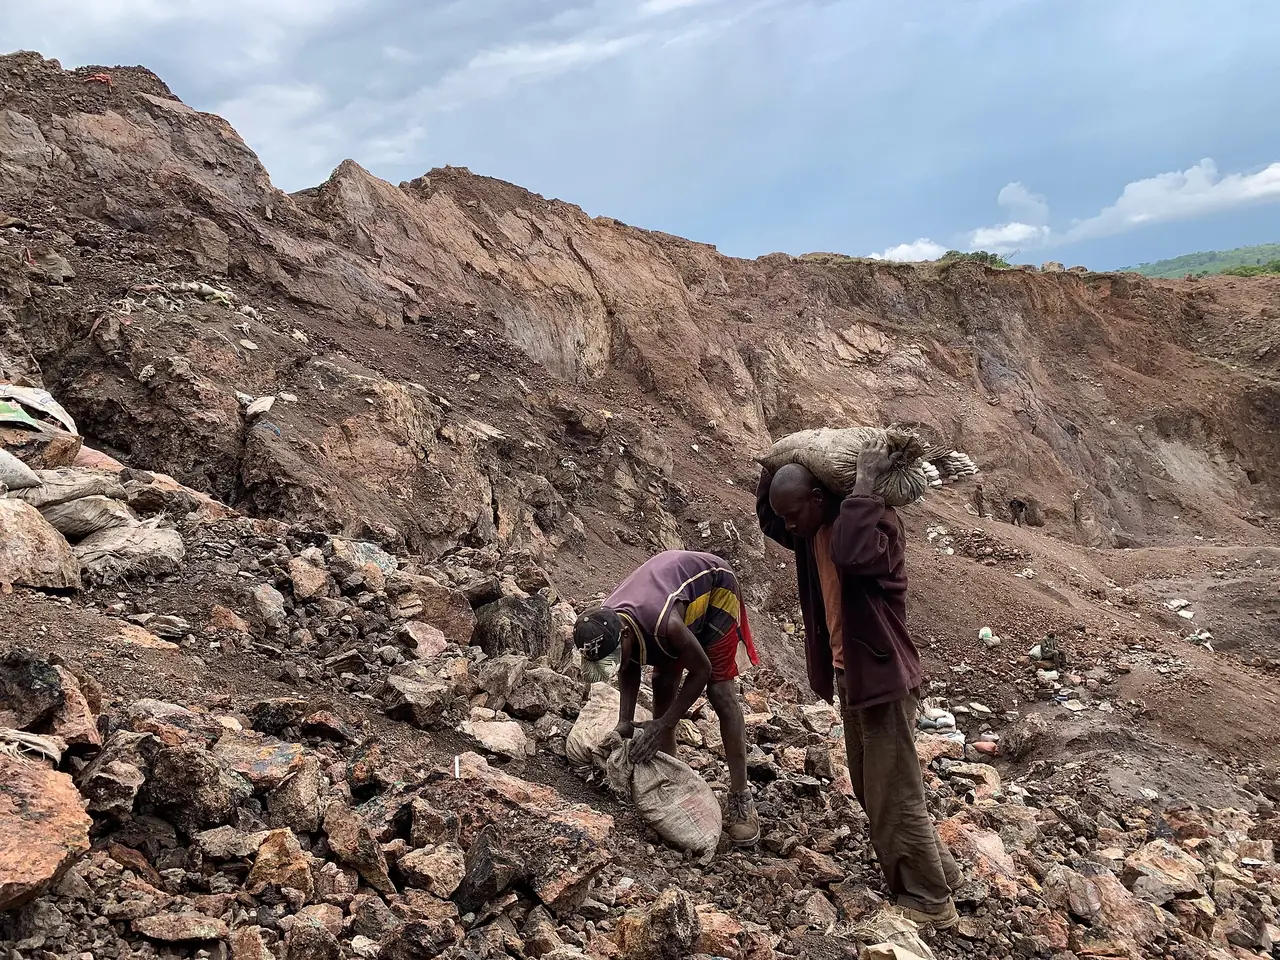
 DR Congo 74%
Battery metal
Cobalt
China refines 79% of the world's cobalt but mines less than 1%.
DR Congo 74%
Battery metal
Cobalt
China refines 79% of the world's cobalt but mines less than 1%.
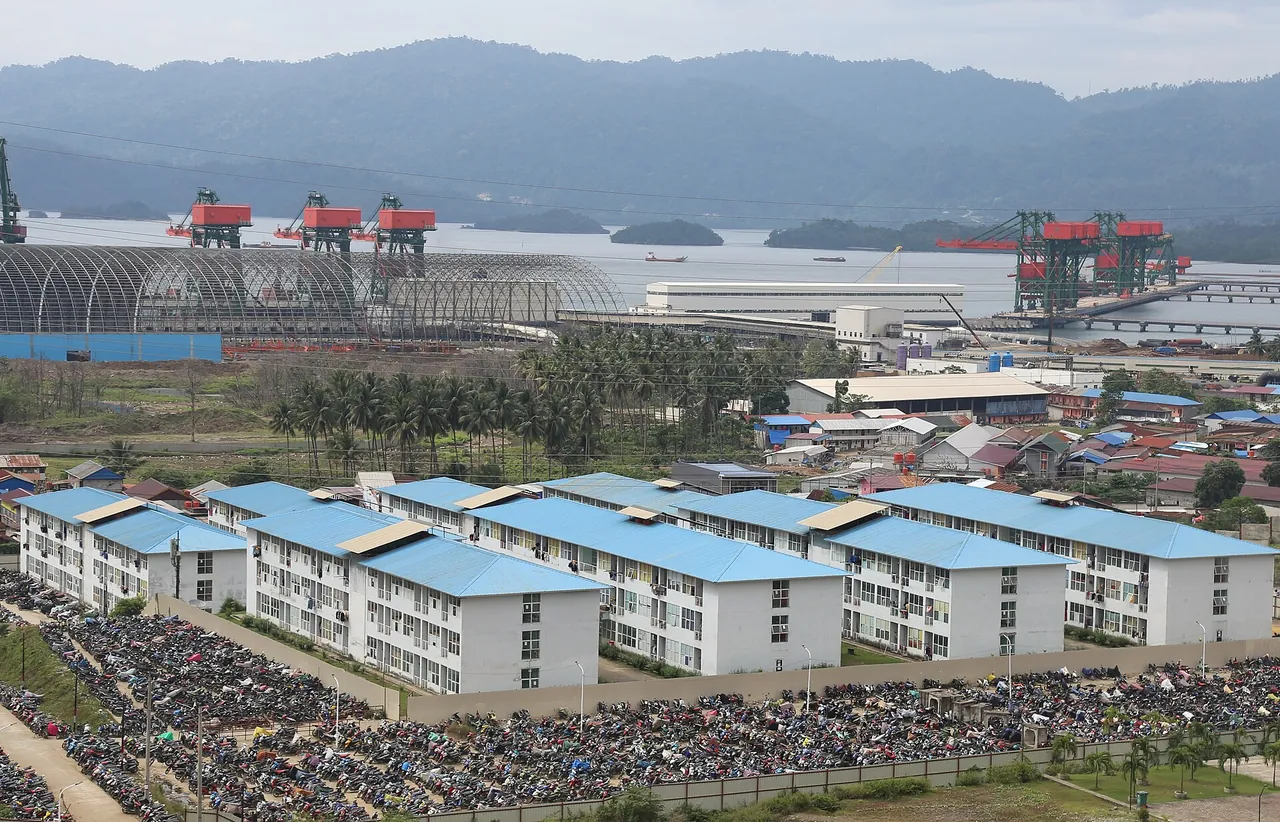
 Indonesia 67%
Battery metal
Nickel
Indonesia mines 67% of the world's nickel; Chinese firms run 75% of its smelters.
Indonesia 67%
Battery metal
Nickel
Indonesia mines 67% of the world's nickel; Chinese firms run 75% of its smelters.
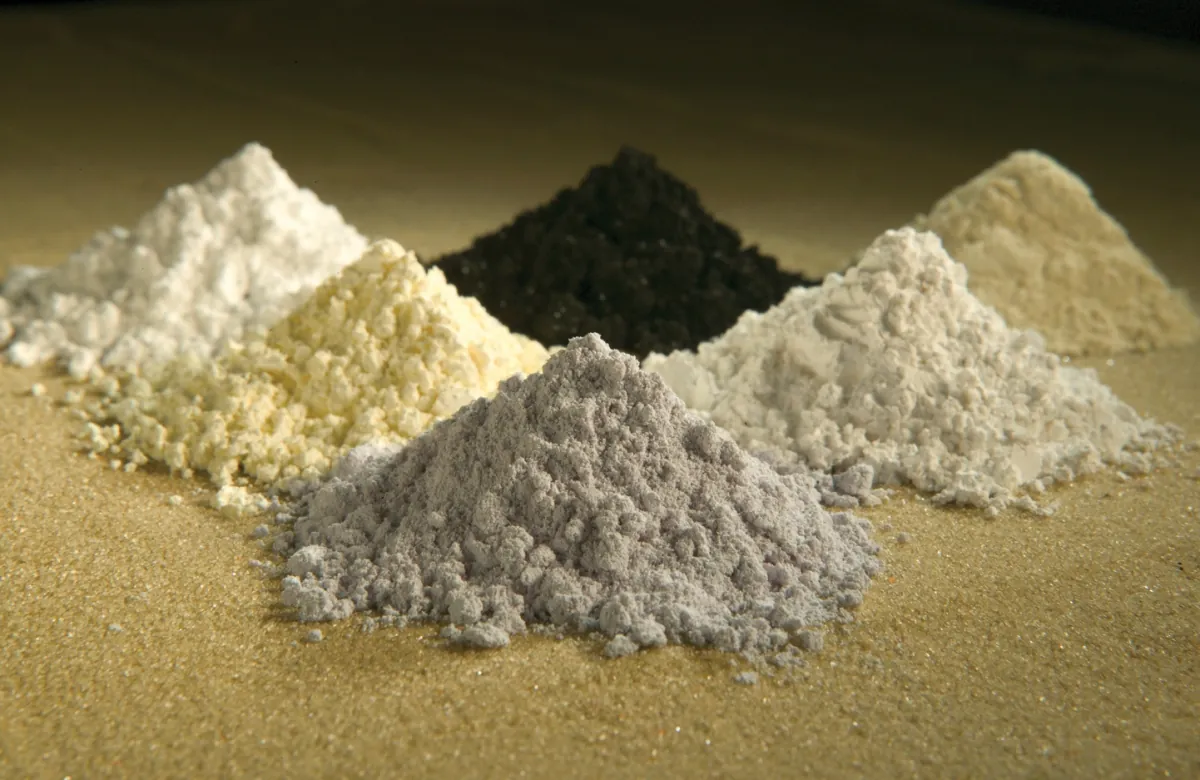
 China 69%
Critical mineral
Rare earths
China mines 69% of rare earths, refines 85% and makes 94% of the magnets.
China 69%
Critical mineral
Rare earths
China mines 69% of rare earths, refines 85% and makes 94% of the magnets.
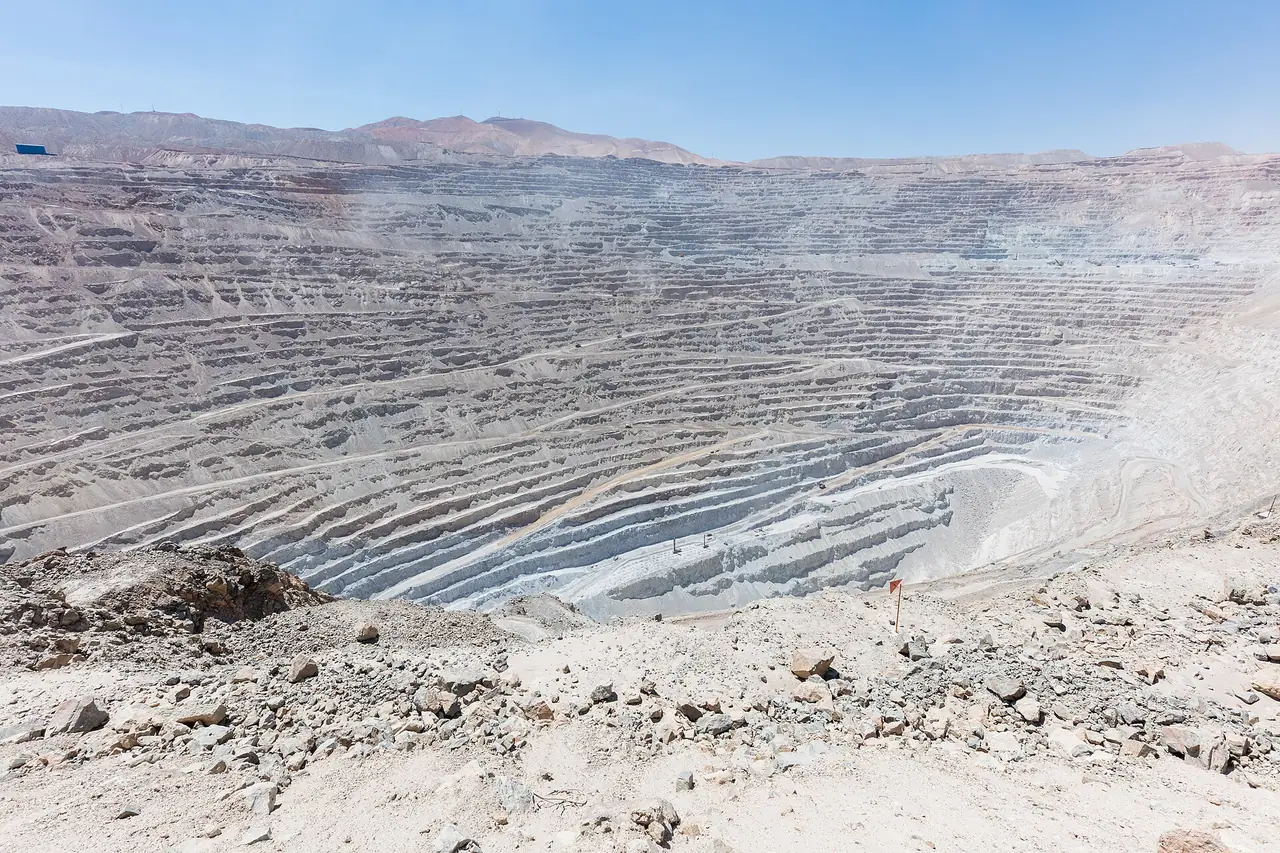
 Chile 23%
Industrial metal
Copper
China refines 48% of the world's copper but mines only 8%.
Chile 23%
Industrial metal
Copper
China refines 48% of the world's copper but mines only 8%.
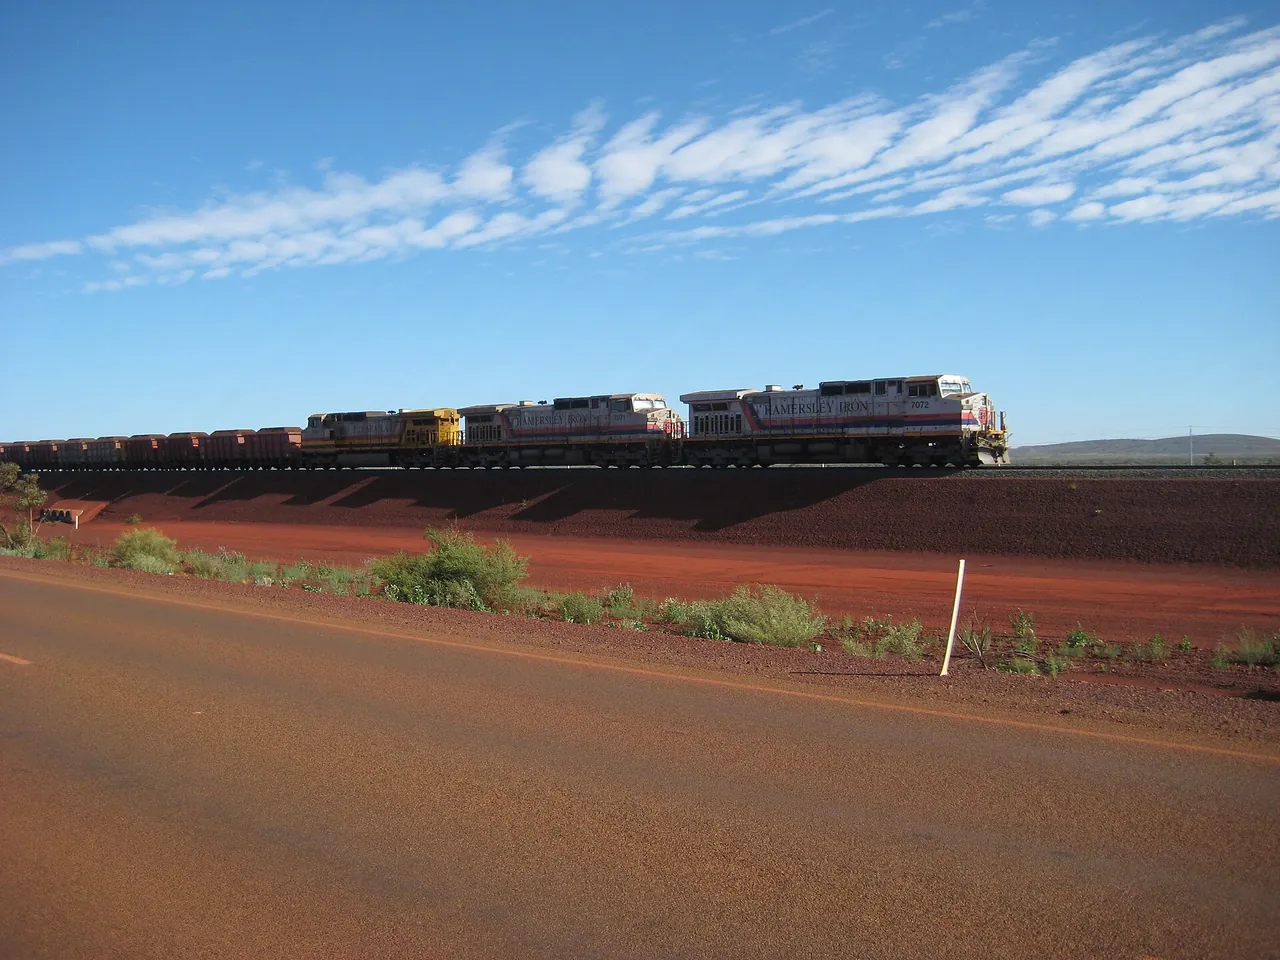 Australia 38%
Industrial metal
Iron ore
China mines 11% of the world's iron ore but buys three quarters of seaborne trade.
Australia 38%
Industrial metal
Iron ore
China mines 11% of the world's iron ore but buys three quarters of seaborne trade.
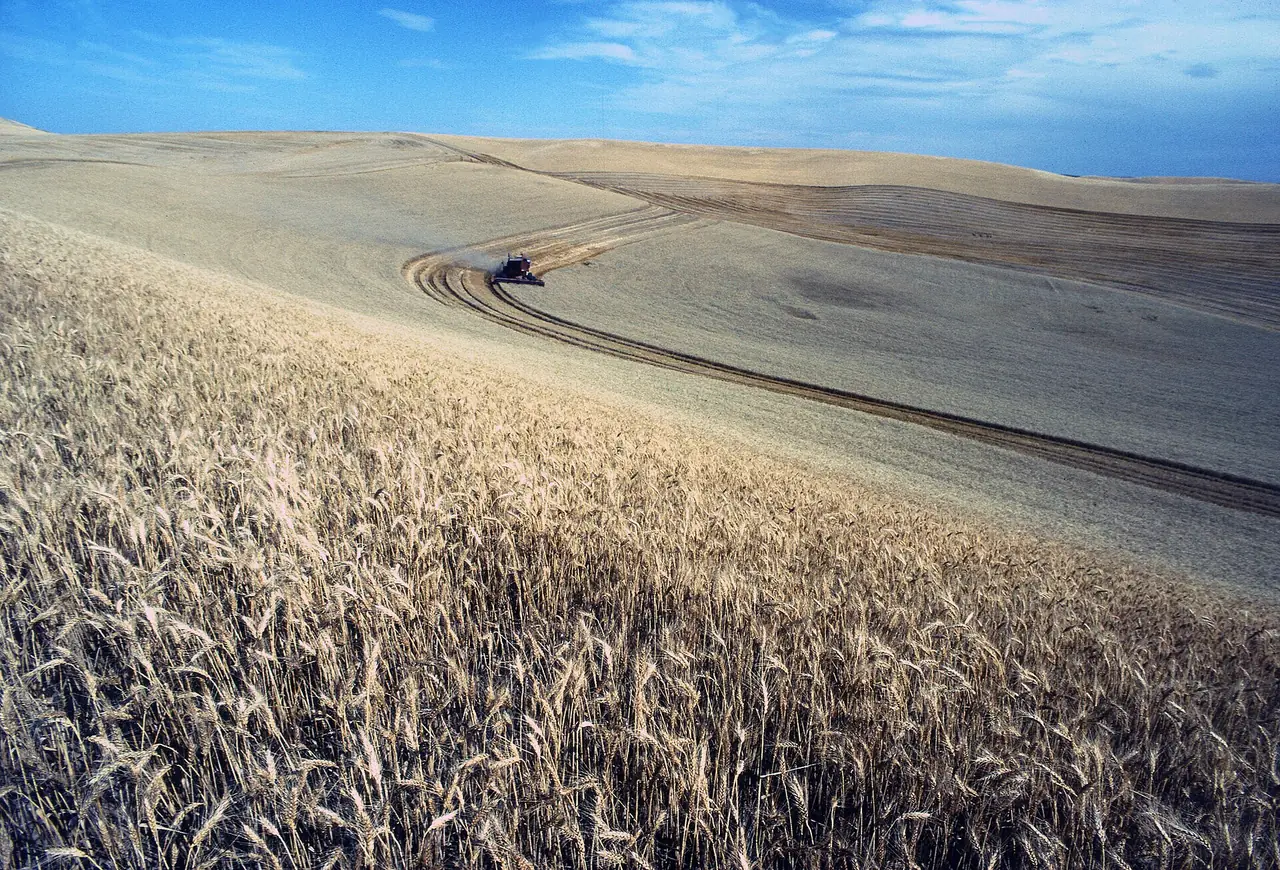 China 17.5%
Food and farming
Wheat
China grows the most wheat. Russia exports the most, 21% of world trade.
China 17.5%
Food and farming
Wheat
China grows the most wheat. Russia exports the most, 21% of world trade.
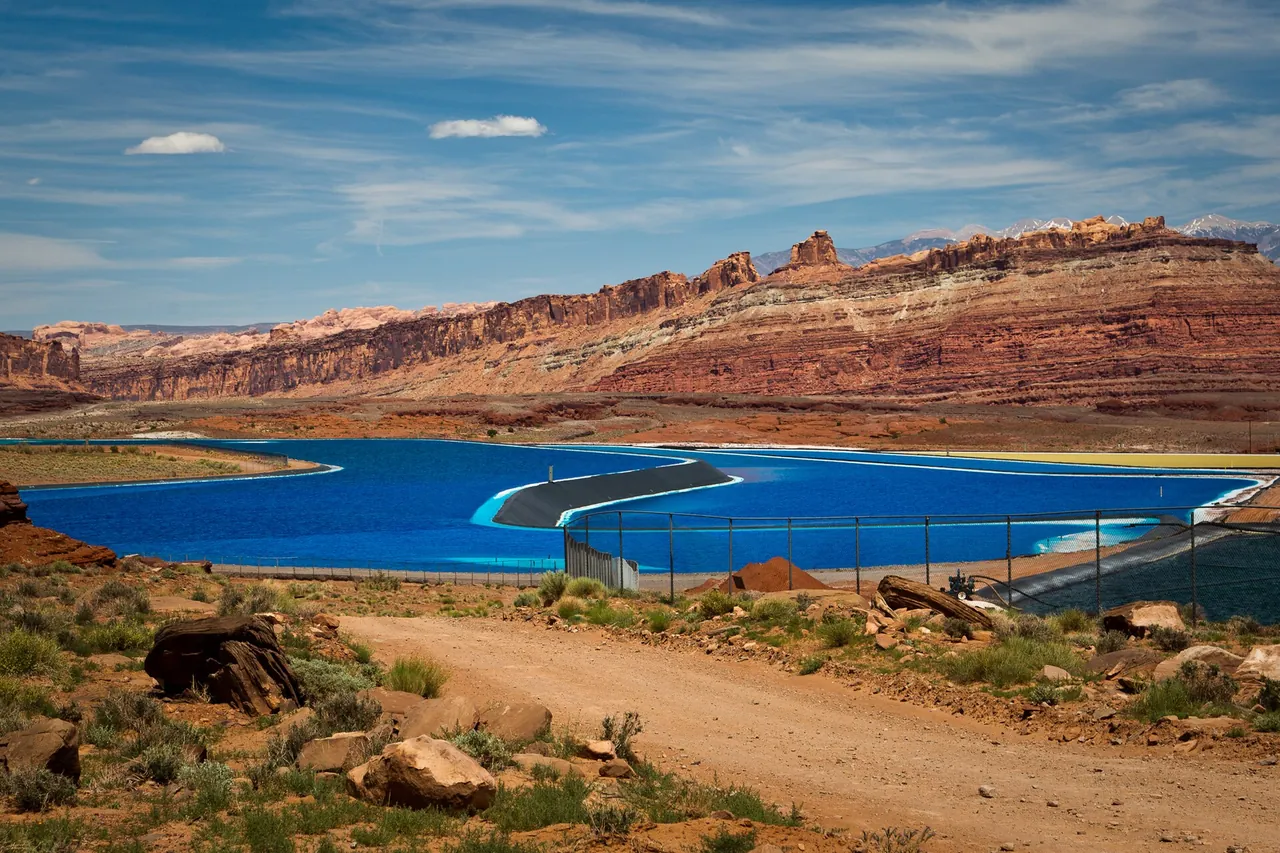
 Canada 31%
Food and farming
Potash and phosphate
Morocco holds 68% of the world's phosphate rock reserves.
Canada 31%
Food and farming
Potash and phosphate
Morocco holds 68% of the world's phosphate rock reserves.
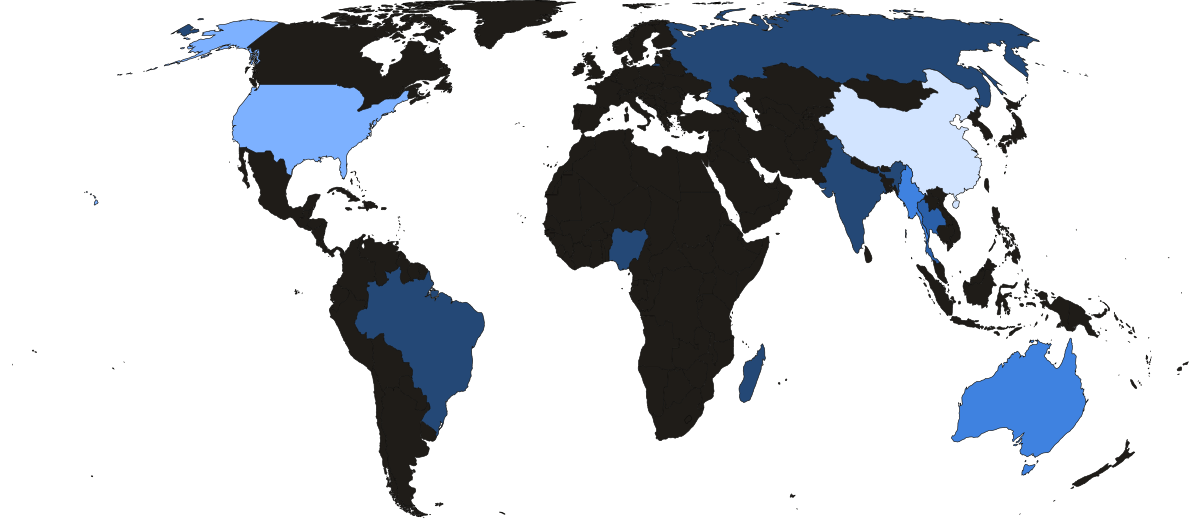 Ranking
Critical minerals by country
Rare earths, lithium, cobalt, nickel, graphite and copper in one table.
Ranking
Critical minerals by country
Rare earths, lithium, cobalt, nickel, graphite and copper in one table.
Which country produces the most of each resource?
A single country often produces far more than the rest. DR Congo produces 74% of the world's cobalt, China 69% of rare earths and Indonesia 67% of nickel.
Crude oil and wheat are spread more widely: the United States pumps 16% of crude oil and China grows 17.5% of wheat. China is the top refiner or user of most resources on the list.
| Resource | Largest producer | Share of world | Refined most by | Used most by |
|---|---|---|---|---|
| Cobalt |
DR Congo |
74% | China |
China |
| Rare earths |
China |
69% | China |
China |
| Nickel |
Indonesia |
67% | Indonesia |
China |
| Uranium |
Kazakhstan |
39% |  Russia Russia |
United States |
| Iron ore |
Australia |
38% | China |
China |
| Lithium |
Australia |
32% | China |
China |
| Potash and phosphate |
Canada |
31% | Not refined | China |
| Natural gas |
United States |
25% | Not refined | United States |
| Copper |
Chile |
23% | China |
China |
| Wheat |
China |
17.5% | Not refined | China |
| Crude oil |
United States |
16.1% | China |
United States |
Share of world mine or field output in 2025, except natural gas and wheat (2024) and uranium (2024). Refining means enrichment for uranium and steelmaking for iron ore.
Which resources does China control?
Mostly the refining. For every resource in the chart, China's share of refining is larger than its share of mining. The gap is widest for cobalt: China mines 0.6% of the world's cobalt but refines 79%.
Chinese companies also own mines abroad and buy ore from other countries' mines. Chinese-majority-owned mines produced 72% of DR Congo's cobalt in 2025, and 94% of Australia's lithium concentrate exports went to China in the first half of 2025.
China's share of the world
MinedRefined- Rare earths69% → 85%
- Cobalt0.6% → 79%
- Lithium21% → 70%
- Iron ore11% → 52%
- Copper7.8% → 48%
- Nickel3.1% → 29%