Ranking · Food, industry and space
Shipbuilding by country
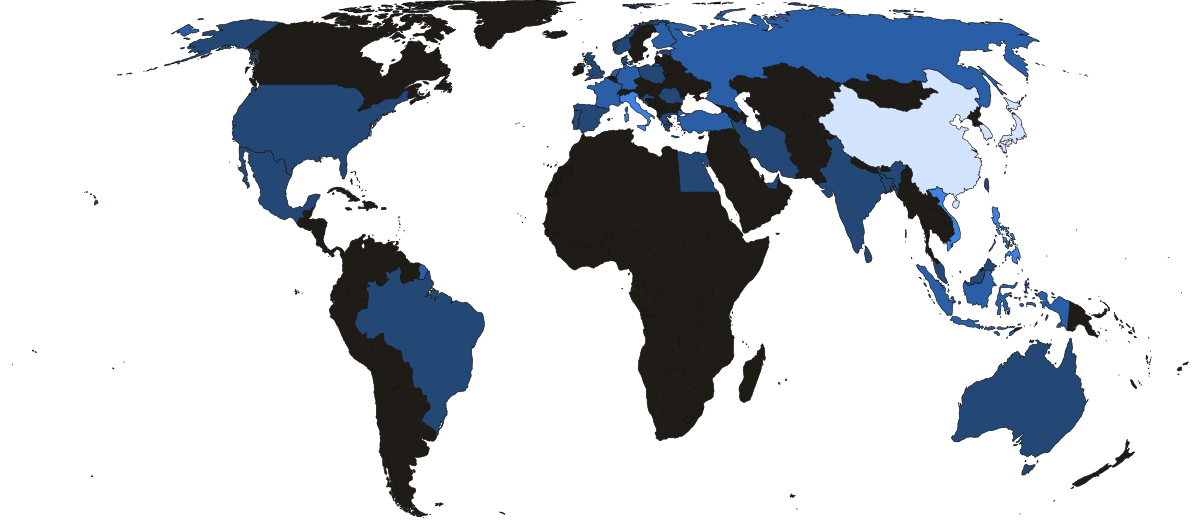
China built 41.6 million gross tons of new ships in 2025, 54% of the world's 77.3 million. South Korea was second with 21.1 million gross tons and Japan third with 10.1 million. Those three countries together built more than 94% of all merchant ship tonnage. China's share has risen from 37% in 2015 to 54% in 2025.
Where the world's 77.3 million gross tons of new ships were built in 2025
Share of new ships delivered in 2025, by gross tonnage
 China 54%
 South Korea 27%
 13%
6%
13%
6%
- China 41.6
- South Korea 21.1
- Japan 10.1
- Everyone else 4.4
- Under 0.1
- 0.1–0.5
- 0.5–2
- 2–10
- Over 10
- Not in this ranking
- Under 5
- 5–20
- 20–60
- 60–150
- Over 150
- Not in this ranking
- Under 5
- 5–20
- 20–60
- 60–150
- Over 150
- Not in this ranking
| # | Country | Built | Fleet owned | Fleet flagged | Share of world |
|---|---|---|---|---|---|
| 1 | China |
41.6 | 377 | 142 | 53.8% |
| 2 | South Korea |
21.1 | 99.2 | 23.8 | 27.3% |
| 3 | Japan |
10.1 | 243 | 47.1 | 13.1% |
| 4 |  Vietnam Vietnam |
0.89 | 20.7 | 9.9 | 1.2% |
| 5 |  Italy Italy |
0.65 | 10.7 | 7.1 | 0.8% |
| 6 |  Philippines Philippines |
0.64 | 5.5 | 6.1 | 0.8% |
| 7 |  Germany Germany |
0.43 | 69.0 | 8.7 | 0.6% |
| 8 |  France France |
0.41 | 26.6 | 10.8 | 0.5% |
| 9 |  Finland Finland |
0.30 | 2.4 | 0.99 | 0.4% |
| 10 |  Russia Russia |
0.21 | 17.5 | 19.6 | 0.3% |
| 11 |  Indonesia Indonesia |
0.19 | 35.1 | 36.4 | 0.2% |
| 12 |  Turkey Turkey |
0.15 | 47.7 | 6.9 | 0.2% |
| 13 |  Netherlands Netherlands |
0.11 | 18.0 | 6.6 | 0.1% |
| 14 |  India India |
0.06 | 28.8 | 19.0 | 0.1% |
| 15 |  Norway Norway |
0.06 | 49.8 | 20.9 | 0.1% |
| 16 |  Malaysia Malaysia |
0.05 | 9.5 | 9.3 | 0.1% |
| 17 |  Poland Poland |
0.05 | 2.4 | · | 0.1% |
| 18 |  Romania Romania |
0.05 | 1.6 | · | 0.1% |
| 19 |  United States United States |
0.03 | 45.6 | 13.4 | 0.0% |
| 20 |  Croatia Croatia |
0.02 | 2.1 | 1.3 | 0.0% |
| 21 |  Spain Spain |
0.02 | 3.5 | 1.3 | 0.0% |
| 22 |  Bangladesh Bangladesh |
0.01 | 6.0 | 6.1 | 0.0% |
| 23 |  Greece Greece |
0.01 | 397 | 51.7 | 0.0% |
| 24 |  Portugal Portugal |
0.01 | 1.2 | 39.3 | 0.0% |
| 25 |  Singapore Singapore |
0.01 | 182 | 186 | 0.0% |
| 26 |  Sri Lanka Sri Lanka |
0.01 | · | · | 0.0% |
| 27 |  United Arab Emirates United Arab Emirates |
0.01 | 59.6 | 0.94 | 0.0% |
| 28 |  Australia Australia |
0.00 | 4.3 | 2.3 | 0.0% |
| 29 |  Brazil Brazil |
0.00 | 15.3 | 6.5 | 0.0% |
| 30 |  Denmark Denmark |
0.00 | 45.1 | 25.4 | 0.0% |
| 31 |  Egypt Egypt |
0.00 | 4.6 | 1.9 | 0.0% |
| 32 |  Estonia Estonia |
0.00 | 0.97 | · | 0.0% |
| 33 |  Iran Iran |
0.00 | 19.4 | 20.2 | 0.0% |
| 34 |  Mexico Mexico |
0.00 | 1.9 | 2.2 | 0.0% |
| 35 |  Taiwan Taiwan |
0.00 | 66.2 | 5.9 | 0.0% |
| 36 |  United Kingdom United Kingdom |
0.00 | 61.1 | 9.8 | 0.0% |
| # | Country | Fleet owned | Built | Fleet flagged | Share of world |
|---|---|---|---|---|---|
| 1 | Greece |
397 | 0.01 | 51.7 | 0.0% |
| 2 | China |
377 | 41.6 | 142 | 53.8% |
| 3 | Japan |
243 | 10.1 | 47.1 | 13.1% |
| 4 | Singapore |
182 | 0.01 | 186 | 0.0% |
| 5 | South Korea |
99.2 | 21.1 | 23.8 | 27.3% |
| 6 | Germany |
69.0 | 0.43 | 8.7 | 0.6% |
| 7 | Taiwan |
66.2 | 0.00 | 5.9 | 0.0% |
| 8 | United Kingdom |
61.1 | 0.00 | 9.8 | 0.0% |
| 9 | United Arab Emirates |
59.6 | 0.01 | 0.94 | 0.0% |
| 10 |  Switzerland Switzerland |
58.2 | · | 0.73 | NaN% |
| 11 | Norway |
49.8 | 0.06 | 20.9 | 0.1% |
| 12 | Turkey |
47.7 | 0.15 | 6.9 | 0.2% |
| 13 | United States |
45.6 | 0.03 | 13.4 | 0.0% |
| 14 | Denmark |
45.1 | 0.00 | 25.4 | 0.0% |
| 15 | Indonesia |
35.1 | 0.19 | 36.4 | 0.2% |
| 16 |  Belgium Belgium |
31.5 | · | 12.3 | NaN% |
| 17 |  Monaco Monaco |
30.6 | · | · | NaN% |
| 18 | India |
28.8 | 0.06 | 19.0 | 0.1% |
| 19 |  Cyprus Cyprus |
28.0 | · | 35.2 | NaN% |
| 20 | France |
26.6 | 0.41 | 10.8 | 0.5% |
| 21 | Vietnam |
20.7 | 0.89 | 9.9 | 1.2% |
| 22 |  Saudi Arabia Saudi Arabia |
20.3 | · | 19.5 | NaN% |
| 23 | Iran |
19.4 | 0.00 | 20.2 | 0.0% |
| 24 | Netherlands |
18.0 | 0.11 | 6.6 | 0.1% |
| 25 | Russia |
17.5 | 0.21 | 19.6 | 0.3% |
| 26 | Brazil |
15.3 | 0.00 | 6.5 | 0.0% |
| 27 | Italy |
10.7 | 0.65 | 7.1 | 0.8% |
| 28 |  Canada Canada |
10.3 | · | 3.4 | NaN% |
| 29 |  Nigeria Nigeria |
10.1 | · | 7.3 | NaN% |
| 30 | Malaysia |
9.5 | 0.05 | 9.3 | 0.1% |
| 31 |  Oman Oman |
8.3 | · | 4.4 | NaN% |
| 32 |  Qatar Qatar |
7.5 | · | 0.71 | NaN% |
| 33 | Bangladesh |
6.0 | 0.01 | 6.1 | 0.0% |
| 34 |  Thailand Thailand |
5.8 | · | 4.8 | NaN% |
| 35 |  Kuwait Kuwait |
5.6 | · | 4.7 | NaN% |
| 36 | Philippines |
5.5 | 0.64 | 6.1 | 0.8% |
| 37 |  Azerbaijan Azerbaijan |
5.4 | · | 1.2 | NaN% |
| 38 |  Angola Angola |
4.8 | · | 0.68 | NaN% |
| 39 | Egypt |
4.6 | 0.00 | 1.9 | 0.0% |
| 40 |  Luxembourg Luxembourg |
4.4 | · | 1.5 | NaN% |
| 41 | Australia |
4.3 | 0.00 | 2.3 | 0.0% |
| 42 |  Malta Malta |
4.1 | · | 114 | NaN% |
| 43 |  Sweden Sweden |
4.0 | · | 1.7 | NaN% |
| 44 | Spain |
3.5 | 0.02 | 1.3 | 0.0% |
| 45 |  Israel Israel |
3.0 | · | · | NaN% |
| 46 |  Ireland Ireland |
3.0 | · | · | NaN% |
| 47 |  Venezuela Venezuela |
2.8 | · | 1.6 | NaN% |
| 48 |  Bulgaria Bulgaria |
2.6 | · | · | NaN% |
| 49 |  Lebanon Lebanon |
2.5 | · | · | NaN% |
| 50 | Poland |
2.4 | 0.05 | · | 0.1% |
| 51 | Finland |
2.4 | 0.30 | 0.99 | 0.4% |
| 52 |  Libya Libya |
2.1 | · | 0.95 | NaN% |
| 53 | Croatia |
2.1 | 0.02 | 1.3 | 0.0% |
| 54 | Mexico |
1.9 | 0.00 | 2.2 | 0.0% |
| 55 |  Ukraine Ukraine |
1.8 | · | · | NaN% |
| 56 |  Marshall Islands Marshall Islands |
1.7 | · | 318 | NaN% |
| 57 |  Argentina Argentina |
1.6 | · | 0.78 | NaN% |
| 58 | Romania |
1.6 | 0.05 | · | 0.1% |
| 59 |  Pakistan Pakistan |
1.3 | · | 0.87 | NaN% |
| 60 |  Seychelles Seychelles |
1.3 | · | · | NaN% |
| 61 |  Chile Chile |
1.3 | · | 0.91 | NaN% |
| 62 |  Kazakhstan Kazakhstan |
1.3 | · | · | NaN% |
| 63 | Portugal |
1.2 | 0.01 | 39.3 | 0.0% |
| 64 |  Algeria Algeria |
1.1 | · | 0.65 | NaN% |
| 65 |  North Korea North Korea |
1.1 | · | 1.3 | NaN% |
| 66 |  Latvia Latvia |
1.1 | · | · | NaN% |
| 67 |  Bahamas Bahamas |
1.1 | · | 71.3 | NaN% |
| 68 | Estonia |
0.97 | 0.00 | · | 0.0% |
| 69 |  Mozambique Mozambique |
0.96 | · | 2.1 | NaN% |
| 70 |  Panama Panama |
0.91 | · | 350 | NaN% |
| 71 |  Suriname Suriname |
0.91 | · | · | NaN% |
| 72 |  Yemen Yemen |
0.85 | · | · | NaN% |
| 73 |  Peru Peru |
0.84 | · | 0.52 | NaN% |
| 74 |  Ghana Ghana |
0.77 | · | · | NaN% |
| 75 |  Liberia Liberia |
0.77 | · | 447 | NaN% |
| 76 |  Equatorial Guinea Equatorial Guinea |
0.58 | · | · | NaN% |
| 77 |  Georgia Georgia |
0.57 | · | · | NaN% |
| 78 |  Ecuador Ecuador |
0.55 | · | · | NaN% |
| 79 |  South Africa South Africa |
0.54 | · | · | NaN% |
| # | Country | Fleet flagged | Built | Fleet owned | Share of world |
|---|---|---|---|---|---|
| 1 | Liberia |
447 | · | 0.77 | NaN% |
| 2 | Panama |
350 | · | 0.91 | NaN% |
| 3 | Marshall Islands |
318 | · | 1.7 | NaN% |
| 4 | Singapore |
186 | 0.01 | 182 | 0.0% |
| 5 | China |
142 | 41.6 | 377 | 53.8% |
| 6 | Malta |
114 | · | 4.1 | NaN% |
| 7 | Bahamas |
71.3 | · | 1.1 | NaN% |
| 8 | Greece |
51.7 | 0.01 | 397 | 0.0% |
| 9 | Japan |
47.1 | 10.1 | 243 | 13.1% |
| 10 | Portugal |
39.3 | 0.01 | 1.2 | 0.0% |
| 11 | Indonesia |
36.4 | 0.19 | 35.1 | 0.2% |
| 12 | Cyprus |
35.2 | · | 28.0 | NaN% |
| 13 | Denmark |
25.4 | 0.00 | 45.1 | 0.0% |
| 14 | South Korea |
23.8 | 21.1 | 99.2 | 27.3% |
| 15 | Norway |
20.9 | 0.06 | 49.8 | 0.1% |
| 16 | Iran |
20.2 | 0.00 | 19.4 | 0.0% |
| 17 | Russia |
19.6 | 0.21 | 17.5 | 0.3% |
| 18 | Saudi Arabia |
19.5 | · | 20.3 | NaN% |
| 19 | India |
19.0 | 0.06 | 28.8 | 0.1% |
| 20 |  Barbados Barbados |
14.5 | · | · | NaN% |
| 21 |  Cameroon Cameroon |
14.5 | · | · | NaN% |
| 22 | United States |
13.4 | 0.03 | 45.6 | 0.0% |
| 23 |  Sierra Leone Sierra Leone |
13.4 | · | · | NaN% |
| 24 | Belgium |
12.3 | · | 31.5 | NaN% |
| 25 | France |
10.8 | 0.41 | 26.6 | 0.5% |
| 26 | Vietnam |
9.9 | 0.89 | 20.7 | 1.2% |
| 27 | United Kingdom |
9.8 | 0.00 | 61.1 | 0.0% |
| 28 | Malaysia |
9.3 | 0.05 | 9.5 | 0.1% |
| 29 |  Antigua and Barbuda Antigua and Barbuda |
9.0 | · | · | NaN% |
| 30 | Germany |
8.7 | 0.43 | 69.0 | 0.6% |
| 31 |  Comoros Comoros |
8.6 | · | · | NaN% |
| 32 | Nigeria |
7.3 | · | 10.1 | NaN% |
| 33 |  Gambia Gambia |
7.3 | · | · | NaN% |
| 34 |  Palau Palau |
7.1 | · | · | NaN% |
| 35 | Italy |
7.1 | 0.65 | 10.7 | 0.8% |
| 36 | Turkey |
6.9 | 0.15 | 47.7 | 0.2% |
| 37 | Netherlands |
6.6 | 0.11 | 18.0 | 0.1% |
| 38 | Brazil |
6.5 | 0.00 | 15.3 | 0.0% |
| 39 | Bangladesh |
6.1 | 0.01 | 6.0 | 0.0% |
| 40 | Philippines |
6.1 | 0.64 | 5.5 | 0.8% |
| 41 | Taiwan |
5.9 | 0.00 | 66.2 | 0.0% |
| 42 |  Guyana Guyana |
5.7 | · | · | NaN% |
| 43 |  Saint Kitts and Nevis Saint Kitts and Nevis |
5.6 | · | · | NaN% |
| 44 | Thailand |
4.8 | · | 5.8 | NaN% |
| 45 | Kuwait |
4.7 | · | 5.6 | NaN% |
| 46 | Oman |
4.4 | · | 8.3 | NaN% |
| 47 |  Guinea Guinea |
4.0 | · | · | NaN% |
| 48 | Canada |
3.4 | · | 10.3 | NaN% |
| 49 |  Belize Belize |
3.3 | · | · | NaN% |
| 50 |  Saint Vincent and the Grenadines Saint Vincent and the Grenadines |
2.7 | · | · | NaN% |
| 51 |  Tanzania Tanzania |
2.6 | · | · | NaN% |
| 52 |  São Tomé and Príncipe São Tomé and Príncipe |
2.6 | · | · | NaN% |
| 53 |  Benin Benin |
2.6 | · | · | NaN% |
| 54 |  San Marino San Marino |
2.3 | · | · | NaN% |
| 55 |  Djibouti Djibouti |
2.3 | · | · | NaN% |
| 56 | Australia |
2.3 | 0.00 | 4.3 | 0.0% |
| 57 | Mexico |
2.2 | 0.00 | 1.9 | 0.0% |
| 58 | Mozambique |
2.1 | · | 0.96 | NaN% |
| 59 |  Tuvalu Tuvalu |
2.0 | · | · | NaN% |
| 60 | Egypt |
1.9 | 0.00 | 4.6 | 0.0% |
| 61 |  Vanuatu Vanuatu |
1.9 | · | · | NaN% |
| 62 | Sweden |
1.7 | · | 4.0 | NaN% |
| 63 | Venezuela |
1.6 | · | 2.8 | NaN% |
| 64 |  Guinea-Bissau Guinea-Bissau |
1.5 | · | · | NaN% |
| 65 | Luxembourg |
1.5 | · | 4.4 | NaN% |
| 66 |  Togo Togo |
1.4 | · | · | NaN% |
| 67 | Spain |
1.3 | 0.02 | 3.5 | 0.0% |
| 68 | North Korea |
1.3 | · | 1.1 | NaN% |
| 69 | Croatia |
1.3 | 0.02 | 2.1 | 0.0% |
| 70 | Azerbaijan |
1.2 | · | 5.4 | NaN% |
| 71 |  Gabon Gabon |
1.0 | · | · | NaN% |
| 72 | Finland |
0.99 | 0.30 | 2.4 | 0.4% |
| 73 | Libya |
0.95 | · | 2.1 | NaN% |
| 74 | United Arab Emirates |
0.94 | 0.01 | 59.6 | 0.0% |
| 75 |  Botswana Botswana |
0.92 | · | · | NaN% |
| 76 | Chile |
0.91 | · | 1.3 | NaN% |
| 77 |  Mongolia Mongolia |
0.91 | · | · | NaN% |
| 78 | Pakistan |
0.87 | · | 1.3 | NaN% |
| 79 |  Tonga Tonga |
0.86 | · | · | NaN% |
| 80 |  Honduras Honduras |
0.83 | · | · | NaN% |
| 81 | Argentina |
0.78 | · | 1.6 | NaN% |
| 82 | Switzerland |
0.73 | · | 58.2 | NaN% |
| 83 | Qatar |
0.71 | · | 7.5 | NaN% |
| 84 | Angola |
0.68 | · | 4.8 | NaN% |
| 85 | Algeria |
0.65 | · | 1.1 | NaN% |
| 86 |  Cuba Cuba |
0.57 | · | · | NaN% |
| 87 | Peru |
0.52 | · | 0.84 | NaN% |
| 88 |  Côte d'Ivoire Côte d'Ivoire |
0.50 | · | · | NaN% |
Why they rank where they do
-
China
China Daily called 2025 China's 16th straight year as the world's largest shipbuilder. A US Congressional Research Service report says about 90% of the ships Chinese yards built in 2025 were for export.
-
South Korea
South Korean yards hold about two-thirds of the world order book for LNG carriers, according to Wood Mackenzie. HD Hyundai, Hanwha Ocean and Samsung Heavy Industries won more than $37.7 billion of orders in 2025.
-
Japan
Japan aims to double output to 18 million gross tons by 2035, in a program of about ¥1 trillion. In January 2026, Imabari, Japan's largest shipbuilder, raised its stake in JMU, the second-largest, to 60%.
-
Vietnam
One yard, HD Hyundai Vietnam Shipbuilding, delivered about 80% of Vietnam's 2025 tonnage. The yard, a Korean-Vietnamese joint venture, plans to raise output from 15 ships a year to 23 by 2030.
-
Italy
Italy's rank comes from Fincantieri, which builds very large cruise ships. Fincantieri delivered 24 vessels in 2025 and reported a record backlog of €63.2 billion.
-
Philippines
HD Hyundai leased the former Hanjin yard at Subic Bay and began cutting steel there in September 2025. The first new ship, the 115,000 dwt tanker Orion Jade, was launched on July 29, 2026.
-
Germany
Germany's Meyer Werft builds large cruise ships, including the 144,000 GT Disney Destiny, delivered in October 2025. In 2024 Germany's federal government and Lower Saxony took about 80% of Meyer Werft in a rescue.
-
Finland
A single ship, Royal Caribbean's Star of the Seas at 248,663 GT, accounts for most of Finland's 0.3 million GT. Gross tonnage measures internal volume, so one huge cruise ship can rank a country high.
-
India
India built just 0.06 million GT in 2025. In September 2025 India's Cabinet approved a ₹69,725 crore shipbuilding and maritime package aiming at 4.5 million GT of yearly shipbuilding capacity.
-
United States
The US built just 25,000 GT of merchant ships in 2025, 0.03% of the world total. This ranking counts only merchant ships, not warships. Hanwha announced a $5 billion plan for Philly Shipyard in August 2025.
-
Greece
Greek owners control the largest fleet by deadweight tonnage, but most Greek-owned ships fly other countries' flags. The Union of Greek Shipowners says shipping is 7% to 8% of Greece's GDP, directly and indirectly.
-
Singapore
Singapore's registry grew about 27% in 2025 to a record 137.46 million gross tons. Trade press reported hundreds of ships moved from Hong Kong's register to Singapore's ahead of US port fees on Chinese-linked ships.
-
Liberia
Liberia's register passed 300 million gross tons in June 2026, the first registry to do so, according to Clarksons figures. Liberia overtook Panama as the largest registry by gross tonnage in 2023.
Which country builds the most ships?
China built 41.6 million gross tons of new merchant ships in 2025, 54% of the world's 77.3 million. South Korea built 21.1 million and Japan 10.1 million. Together those three built more than 94% of all tonnage. China's share was 37% in 2015, 40% in 2020 and 54% in 2025. South Korea's fell from 35% to 27% over the same period. In the first half of 2026, China took about 72% of new orders by compensated gross tonnage, according to Clarksons data.
China41.6
The next five countries together33.4
South Korea, Japan, Vietnam, Italy and Philippines
Why does the United States build so few commercial ships?
The United States built 25,000 gross tons of merchant ships in 2025, 0.03% of the world total, down from 0.5% in 2015. A 2023 US Navy intelligence slide estimated China's shipyard capacity at more than 200 times America's. In April 2025 the US Trade Representative announced port fees on Chinese-owned and Chinese-built ships. From October 14, 2025, Chinese-owned or Chinese-operated ships owed $50 per net ton, set to rise to $140 by 2028. After Donald Trump and Xi Jinping met in Busan, the United States suspended the fees for one year from November 10, 2025. The pause ends on November 9, 2026; as of early October 2026, no extension had been published.
- China41.6
- South Korea21.1
- Japan10.1
- Vietnam0.89
- Italy0.65
- Philippines0.64
- Germany0.43
- France0.41
- Finland0.30
- Russia0.21
- Indonesia0.19
- Turkey0.15
- Netherlands0.11
- India0.06
- Norway0.06
- Malaysia0.05
- Poland0.05
- Romania0.05
- United States0.03
- Croatia0.02
Why do so many ships fly the Liberian or Panamanian flag?
The International Transport Workers' Federation (ITF) says flag-of-convenience registries offer cheap registration fees and low or no taxes. The ITF listed 48 countries as flag-of-convenience registries in 2025. Liberia, Panama and the Marshall Islands together carried 1,114 million deadweight tonnes at the start of 2026, 44% of the world fleet. Liberia overtook Panama as the largest registry by gross tonnage in 2023. Greek owners have 397 million dwt of ships, but only 52 million dwt fly the Greek flag. The flag a ship flies often has no connection to where it was built or who owns it.
- Liberia447
- Panama350
- Marshall Islands318
- Singapore186
- China142
- Malta114
- Bahamas71.3
- Greece51.7
Which country owns the most ships?
Greece had the largest merchant fleet by tonnage at the start of 2026, with 397 million deadweight tonnes. China was second with 377 million and Japan third with 243 million. By number of ships, China leads with 11,186 against Greece's 5,168. If Hong Kong-based owners (122.8 million dwt) were counted with China, the combined total of 499.8 million dwt would surpass Greece. Asian companies owned 56% of world carrying capacity, European companies 34% and North American companies 4%. The world fleet reached 2.5 billion dwt on January 1, 2026.
- Greece397
- China377
- Japan243
- Singapore182
- South Korea99.2
- Germany69.0
- Taiwan66.2
- United Kingdom61.1