Ranking · Food, industry and space
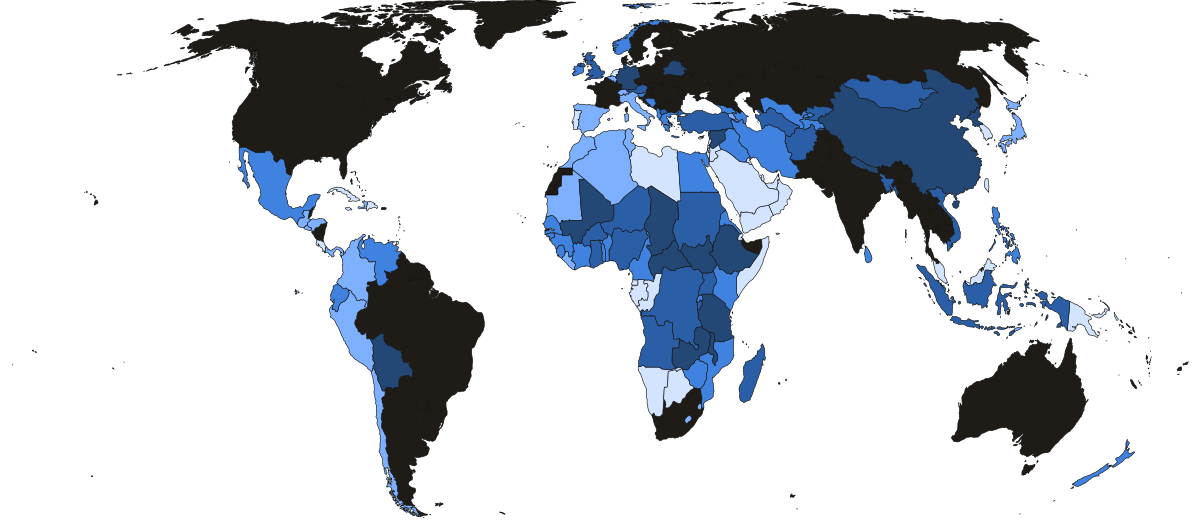
Food import dependence by country
Singapore, Bahrain, Djibouti and Equatorial Guinea import nearly all of their grain, and Qatar, the United Arab Emirates and Kuwait almost as much. Japan imports about three-quarters of its grain and South Korea more than four-fifths. Egypt is the largest wheat importer: it bought 13.1 million tonnes in 2024.
- Under 10%
- 10%–25%
- 25%–50%
- 50%–75%
- Over 75%
- Not in this ranking
- Under 1
- 1–3
- 3–6
- 6–10
- Over 10
- Not in this ranking
- Under 10%
- 10%–25%
- 25%–50%
- 50%–75%
- Over 75%
- Not in this ranking
| # | Country | Grain | Wheat imports | Russia, Ukraine |
|---|---|---|---|---|
| 1 |  Bahrain Bahrain |
100.0% | · | · |
| 2 |  Djibouti Djibouti |
100.0% | · | · |
| 3 |  Equatorial Guinea Equatorial Guinea |
100.0% | · | · |
| 4 |  Singapore Singapore |
100.0% | · | · |
| 5 |  Trinidad and Tobago Trinidad and Tobago |
99.9% | · | · |
| 6 |  Qatar Qatar |
99.7% | · | · |
| 7 |  Jamaica Jamaica |
99.6% | · | · |
| 8 |  Mauritius Mauritius |
99.6% | · | · |
| 9 |  United Arab Emirates United Arab Emirates |
99.3% | 1.5 | · |
| 10 |  Kuwait Kuwait |
97.8% | · | · |
| 11 |  Jordan Jordan |
96.9% | 0.56 | 38.2% |
| 12 |  Papua New Guinea Papua New Guinea |
96.8% | · | · |
| 13 |  Costa Rica Costa Rica |
95.7% | · | · |
| 14 |  Israel Israel |
94.0% | 1.8 | 9.2% |
| 15 |  Republic of the Congo Republic of the Congo |
92.4% | · | · |
| 16 |  Cyprus Cyprus |
92.1% | · | · |
| 17 |  Saudi Arabia Saudi Arabia |
90.2% | 3.4 | 60.7% |
| 18 |  Netherlands Netherlands |
89.5% | 4.6 | 3.8% |
| 19 |  Yemen Yemen |
89.0% | 2.2 | 70.7% |
| 20 |  Oman Oman |
87.7% | 0.90 | 78.8% |
| 21 |  Palestine Palestine |
86.3% | · | · |
| 22 |  Libya Libya |
86.0% | · | · |
| 23 |  Lebanon Lebanon |
85.6% | · | 99.8% |
| 24 |  Botswana Botswana |
85.1% | · | · |
| 25 |  South Korea South Korea |
82.5% | 4.6 | 14.1% |
| 26 |  Malaysia Malaysia |
81.9% | 1.7 | 14.5% |
| 27 |  Somalia Somalia |
81.9% | · | · |
| 28 |  Taiwan Taiwan |
81.9% | 1.5 | · |
| 29 |  Gabon Gabon |
79.8% | · | · |
| 30 |  Portugal Portugal |
79.3% | 1.3 | 21.0% |
| 31 |  Cuba Cuba |
78.0% | · | · |
| 32 |  Namibia Namibia |
76.1% | · | · |
| 33 |  Gambia Gambia |
75.6% | · | · |
| 34 |  Dominican Republic Dominican Republic |
75.2% | 0.76 | · |
| 35 |  Algeria Algeria |
74.9% | 6.9 | 36.0% |
| 36 |  Belgium Belgium |
74.1% | 3.8 | · |
| 37 |  Tunisia Tunisia |
74.0% | 1.4 | 72.5% |
| 38 |  Japan Japan |
73.5% | 5.2 | · |
| 39 |  Haiti Haiti |
73.0% | · | · |
| 40 |  Eswatini Eswatini |
72.5% | · | · |
| 41 |  Colombia Colombia |
71.3% | 1.9 | 1.1% |
| 42 |  Liberia Liberia |
70.4% | · | · |
| 43 |  Morocco Morocco |
69.3% | 5.1 | 24.7% |
| 44 |  Panama Panama |
68.8% | · | · |
| 45 |  Mauritania Mauritania |
66.8% | 0.91 | · |
| 46 |  Armenia Armenia |
66.1% | · | 99.7% |
| 47 |  Honduras Honduras |
64.4% | · | · |
| 48 |  Lesotho Lesotho |
60.3% | · | · |
| 49 |  Chile Chile |
60.1% | 0.98 | · |
| 50 |  Peru Peru |
57.1% | 2.1 | · |
| 51 |  El Salvador El Salvador |
55.7% | · | · |
| 52 |  Timor-Leste Timor-Leste |
53.9% | · | · |
| 53 |  Guatemala Guatemala |
53.7% | 0.72 | · |
| 54 |  Spain Spain |
53.6% | 7.9 | 56.0% |
| 55 |  Switzerland Switzerland |
53.4% | · | 1.0% |
| 56 |  Italy Italy |
52.3% | 9.4 | 7.7% |
| 57 |  Ireland Ireland |
48.8% | 0.56 | 15.0% |
| 58 |  Zimbabwe Zimbabwe |
46.1% | · | 10.2% |
| 59 |  Tajikistan Tajikistan |
46.0% | 1.1 | · |
| 60 |  Georgia Georgia |
44.6% | · | 99.5% |
| 61 |  Egypt Egypt |
43.9% | 13.1 | 82.2% |
| 62 |  Senegal Senegal |
43.9% | 0.90 | 29.0% |
| 63 |  Iraq Iraq |
43.2% | 0.87 | · |
| 64 |  Venezuela Venezuela |
42.8% | 0.84 | · |
| 65 |  Côte d'Ivoire Côte d'Ivoire |
42.7% | 0.72 | · |
| 66 |  Kenya Kenya |
42.7% | 2.3 | 81.5% |
| 67 |  New Zealand New Zealand |
42.5% | 0.59 | · |
| 68 |  Ecuador Ecuador |
41.6% | 1.7 | · |
| 69 |  Benin Benin |
41.2% | · | · |
| 70 |  Mexico Mexico |
40.8% | 4.3 | · |
| 71 |  Mozambique Mozambique |
40.5% | 0.68 | 52.0% |
| 72 |  Rwanda Rwanda |
36.8% | · | · |
| 73 |  Guinea-Bissau Guinea-Bissau |
35.6% | · | · |
| 74 |  Iran Iran |
35.3% | · | · |
| 75 |  Philippines Philippines |
34.4% | 6.8 | 1.3% |
| 76 |  Uzbekistan Uzbekistan |
33.6% | 4.9 | 0.4% |
| 77 |  Norway Norway |
32.9% | · | 2.2% |
| 78 |  Cameroon Cameroon |
32.4% | 1.0 | · |
| 79 |  Eritrea Eritrea |
32.3% | · | · |
| 80 |  Azerbaijan Azerbaijan |
31.2% | 1.3 | 90.2% |
| 81 |  Sierra Leone Sierra Leone |
30.2% | · | · |
| 82 |  Sri Lanka Sri Lanka |
30.2% | 1.0 | 68.4% |
| 83 |  Togo Togo |
27.9% | · | · |
| 84 |  Greece Greece |
27.4% | 1.1 | 24.0% |
| 85 |  Bosnia and Herzegovina Bosnia and Herzegovina |
27.3% | · | · |
| 86 |  Albania Albania |
27.2% | · | · |
| 87 |  Slovenia Slovenia |
25.9% | · | · |
| 88 |  Guinea Guinea |
25.1% | · | · |
| 89 |  Angola Angola |
23.6% | · | 14.5% |
| 90 |  Indonesia Indonesia |
22.4% | 12.1 | 29.6% |
| 91 |  Turkey Turkey |
21.7% | 5.7 | 97.6% |
| 92 |  Mongolia Mongolia |
20.4% | · | · |
| 93 |  Austria Austria |
18.3% | 1.2 | 0.2% |
| 94 |  Vietnam Vietnam |
18.3% | 4.9 | · |
| 95 |  Ghana Ghana |
17.5% | 0.58 | · |
| 96 |  Afghanistan Afghanistan |
17.3% | · | · |
| 97 |  Burkina Faso Burkina Faso |
16.9% | · | 6.3% |
| 98 |  Turkmenistan Turkmenistan |
16.8% | · | · |
| 99 |  Nigeria Nigeria |
16.3% | 5.0 | 14.5% |
| 100 |  DR Congo DR Congo |
16.0% | · | 14.1% |
| 101 |  Madagascar Madagascar |
14.9% | · | · |
| 102 |  United Kingdom United Kingdom |
14.2% | 3.1 | 2.6% |
| 103 |  Burundi Burundi |
13.5% | · | · |
| 104 |  Kyrgyzstan Kyrgyzstan |
13.3% | · | · |
| 105 |  Uganda Uganda |
12.6% | 0.78 | 84.4% |
| 106 |  Sudan Sudan |
12.1% | · | · |
| 107 |  North Macedonia North Macedonia |
11.7% | · | · |
| 108 |  Niger Niger |
11.6% | · | · |
| 109 |  Bangladesh Bangladesh |
10.5% | 2.9 | · |
| 110 |  Nepal Nepal |
9.7% | · | · |
| 111 |  China China |
8.3% | 11.0 | 2.5% |
| 112 |  South Sudan South Sudan |
8.1% | · | · |
| 113 |  Mali Mali |
7.7% | · | 5.8% |
| 114 |  Syria Syria |
7.0% | · | · |
| 115 |  Central African Republic Central African Republic |
6.0% | · | · |
| 116 |  Tanzania Tanzania |
4.8% | 1.3 | 66.1% |
| 117 |  Ethiopia Ethiopia |
3.7% | · | · |
| 118 |  Belarus Belarus |
3.6% | · | · |
| 119 |  Malawi Malawi |
3.1% | · | · |
| 120 |  Chad Chad |
2.7% | · | · |
| 121 |  North Korea North Korea |
2.2% | · | · |
| 122 |  Zambia Zambia |
1.9% | · | · |
| 123 |  Germany Germany |
0.8% | 6.1 | 1.8% |
| 124 |  Bolivia Bolivia |
0.4% | · | · |
| # | Country | Wheat imports | Grain | Russia, Ukraine |
|---|---|---|---|---|
| 1 | Egypt |
13.1 | 43.9% | 82.2% |
| 2 | Indonesia |
12.1 | 22.4% | 29.6% |
| 3 | China |
11.0 | 8.3% | 2.5% |
| 4 | Italy |
9.4 | 52.3% | 7.7% |
| 5 | Spain |
7.9 | 53.6% | 56.0% |
| 6 | Algeria |
6.9 | 74.9% | 36.0% |
| 7 | Philippines |
6.8 | 34.4% | 1.3% |
| 8 |  Brazil Brazil |
6.6 | · | 10.7% |
| 9 | Germany |
6.1 | 0.8% | 1.8% |
| 10 | Turkey |
5.7 | 21.7% | 97.6% |
| 11 | Japan |
5.2 | 73.5% | · |
| 12 | Morocco |
5.1 | 69.3% | 24.7% |
| 13 | Nigeria |
5.0 | 16.3% | 14.5% |
| 14 | Uzbekistan |
4.9 | 33.6% | 0.4% |
| 15 | Vietnam |
4.9 | 18.3% | · |
| 16 | Netherlands |
4.6 | 89.5% | 3.8% |
| 17 | South Korea |
4.6 | 82.5% | 14.1% |
| 18 | Mexico |
4.3 | 40.8% | · |
| 19 |  Thailand Thailand |
4.0 | · | 34.6% |
| 20 | Belgium |
3.8 | 74.1% | · |
| 21 | Saudi Arabia |
3.4 | 90.2% | 60.7% |
| 22 | United Kingdom |
3.1 | 14.2% | 2.6% |
| 23 | Bangladesh |
2.9 | 10.5% | · |
| 24 |  United States United States |
2.4 | · | · |
| 25 | Kenya |
2.3 | 42.7% | 81.5% |
| 26 | Yemen |
2.2 | 89.0% | 70.7% |
| 27 |  Pakistan Pakistan |
2.2 | · | 88.9% |
| 28 | Peru |
2.1 | 57.1% | · |
| 29 |  South Africa South Africa |
2.0 | · | 34.3% |
| 30 | Colombia |
1.9 | 71.3% | 1.1% |
| 31 | Israel |
1.8 | 94.0% | 9.2% |
| 32 | Malaysia |
1.7 | 81.9% | 14.5% |
| 33 | Ecuador |
1.7 | 41.6% | · |
| 34 |  Kazakhstan Kazakhstan |
1.7 | · | 99.7% |
| 35 | United Arab Emirates |
1.5 | 99.3% | · |
| 36 | Taiwan |
1.5 | 81.9% | · |
| 37 | Tunisia |
1.4 | 74.0% | 72.5% |
| 38 | Portugal |
1.3 | 79.3% | 21.0% |
| 39 | Azerbaijan |
1.3 | 31.2% | 90.2% |
| 40 | Tanzania |
1.3 | 4.8% | 66.1% |
| 41 | Austria |
1.2 | 18.3% | 0.2% |
| 42 | Tajikistan |
1.1 | 46.0% | · |
| 43 | Greece |
1.1 | 27.4% | 24.0% |
| 44 | Cameroon |
1.0 | 32.4% | · |
| 45 | Sri Lanka |
1.0 | 30.2% | 68.4% |
| 46 | Chile |
0.98 | 60.1% | · |
| 47 |  Romania Romania |
0.98 | · | · |
| 48 | Mauritania |
0.91 | 66.8% | · |
| 49 | Oman |
0.90 | 87.7% | 78.8% |
| 50 | Senegal |
0.90 | 43.9% | 29.0% |
| 51 | Iraq |
0.87 | 43.2% | · |
| 52 | Venezuela |
0.84 | 42.8% | · |
| 53 | Uganda |
0.78 | 12.6% | 84.4% |
| 54 | Dominican Republic |
0.76 | 75.2% | · |
| 55 | Guatemala |
0.72 | 53.7% | · |
| 56 | Côte d'Ivoire |
0.72 | 42.7% | · |
| 57 | Mozambique |
0.68 | 40.5% | 52.0% |
| 58 |  Latvia Latvia |
0.60 | · | 2.9% |
| 59 | New Zealand |
0.59 | 42.5% | · |
| 60 | Ghana |
0.58 | 17.5% | · |
| 61 |  Poland Poland |
0.57 | · | 0.2% |
| 62 | Jordan |
0.56 | 96.9% | 38.2% |
| 63 | Ireland |
0.56 | 48.8% | 15.0% |
| # | Country | Russia, Ukraine | Grain | Wheat imports |
|---|---|---|---|---|
| 1 | Lebanon |
99.8% | 85.6% | · |
| 2 | Armenia |
99.7% | 66.1% | · |
| 3 | Kazakhstan |
99.7% | · | 1.7 |
| 4 | Georgia |
99.5% | 44.6% | · |
| 5 | Turkey |
97.6% | 21.7% | 5.7 |
| 6 | Azerbaijan |
90.2% | 31.2% | 1.3 |
| 7 | Pakistan |
88.9% | · | 2.2 |
| 8 | Uganda |
84.4% | 12.6% | 0.78 |
| 9 | Egypt |
82.2% | 43.9% | 13.1 |
| 10 | Kenya |
81.5% | 42.7% | 2.3 |
| 11 | Oman |
78.8% | 87.7% | 0.90 |
| 12 | Tunisia |
72.5% | 74.0% | 1.4 |
| 13 | Yemen |
70.7% | 89.0% | 2.2 |
| 14 | Sri Lanka |
68.4% | 30.2% | 1.0 |
| 15 | Tanzania |
66.1% | 4.8% | 1.3 |
| 16 | Saudi Arabia |
60.7% | 90.2% | 3.4 |
| 17 | Spain |
56.0% | 53.6% | 7.9 |
| 18 | Mozambique |
52.0% | 40.5% | 0.68 |
| 19 | Jordan |
38.2% | 96.9% | 0.56 |
| 20 | Algeria |
36.0% | 74.9% | 6.9 |
| 21 | Thailand |
34.6% | · | 4.0 |
| 22 | South Africa |
34.3% | · | 2.0 |
| 23 | Indonesia |
29.6% | 22.4% | 12.1 |
| 24 | Senegal |
29.0% | 43.9% | 0.90 |
| 25 | Morocco |
24.7% | 69.3% | 5.1 |
| 26 | Greece |
24.0% | 27.4% | 1.1 |
| 27 | Portugal |
21.0% | 79.3% | 1.3 |
| 28 | Ireland |
15.0% | 48.8% | 0.56 |
| 29 | Malaysia |
14.5% | 81.9% | 1.7 |
| 30 | Angola |
14.5% | 23.6% | · |
| 31 | Nigeria |
14.5% | 16.3% | 5.0 |
| 32 | South Korea |
14.1% | 82.5% | 4.6 |
| 33 | DR Congo |
14.1% | 16.0% | · |
| 34 | Brazil |
10.7% | · | 6.6 |
| 35 | Zimbabwe |
10.2% | 46.1% | · |
| 36 | Israel |
9.2% | 94.0% | 1.8 |
| 37 | Italy |
7.7% | 52.3% | 9.4 |
| 38 | Burkina Faso |
6.3% | 16.9% | · |
| 39 | Mali |
5.8% | 7.7% | · |
| 40 | Netherlands |
3.8% | 89.5% | 4.6 |
| 41 | Latvia |
2.9% | · | 0.60 |
| 42 | United Kingdom |
2.6% | 14.2% | 3.1 |
| 43 | China |
2.5% | 8.3% | 11.0 |
| 44 | Norway |
2.2% | 32.9% | · |
| 45 | Germany |
1.8% | 0.8% | 6.1 |
| 46 | Philippines |
1.3% | 34.4% | 6.8 |
| 47 | Colombia |
1.1% | 71.3% | 1.9 |
| 48 | Switzerland |
1.0% | 53.4% | · |
| 49 | Uzbekistan |
0.4% | 33.6% | 4.9 |
| 50 | Austria |
0.2% | 18.3% | 1.2 |
| 51 | Poland |
0.2% | · | 0.57 |
Why they rank where they do
-
Singapore
Singapore has almost no farmland, so it imports nearly all of its food.
-
Qatar
Qatar built up food reserves after Saudi Arabia, the United Arab Emirates, Bahrain and Egypt cut off trade and travel with it in 2017.
-
United Arab Emirates
Jebel Ali in Dubai, the largest port in the Middle East, lies inside the Gulf. After the Strait of Hormuz closed in March 2026, ships were diverted to the UAE's ports on the Gulf of Oman, such as Fujairah and Khor Fakkan, and to Oman's ports.
-
Netherlands
The Netherlands imports grain, mostly corn, to feed its pigs, cattle and chickens and for food factories. Grain that only passes through Rotterdam on its way elsewhere does not count here, because exports are subtracted.
-
Lebanon
In 2022, 76.7% of Lebanon's wheat came from Ukraine and 9.4% from Russia. The explosion at the port of Beirut in August 2020 destroyed the country's main grain silos.
-
South Korea
South Korea grows most of the rice it eats but imports nearly all of its wheat and corn.
-
Japan
Japan's government released about 600,000 tonnes of rice from its emergency reserve between March and June 2025 to bring down rice prices.
-
Egypt
In December 2024 Egypt made Mostakbal Misr, an agency linked to the army, the only importer of strategic food such as wheat, in place of the state grain buyer GASC. On June 1, 2024, Egypt quadrupled the price of subsidized bread, from 5 to 20 piastres, the first increase since 1989.
-
Indonesia
Indonesia grows no wheat, so all the wheat in its noodles and bread is imported.
-
Turkey
Turkey is the world's largest flour exporter. It imports wheat without duty if it sends the same amount abroad again as flour. Turkey restricted wheat imports from June 2024 to March 2025, and its flour exports fell 41%.
-
China
China's wheat imports fell 65% in 2025, to about 3.85 million tonnes, while its soybean imports reached a record 112 million tonnes.
-
Pakistan
Pakistan's caretaker government let private traders import wheat without duty and without limits in 2023 and 2024. About 3.5 million tonnes came in, against an expected shortfall of 2.4 million. Pakistan banned wheat imports in July 2024.
Which countries import the most wheat?
Egypt imported 13.1 million tonnes of wheat in 2024, more than any other country. Indonesia was second with 12.1 million and China third with 11.0 million. Italy imported 9.4 million tonnes, much of it for pasta, and Spain 7.9 million. These five countries bought about a quarter of the 205.1 million tonnes of wheat traded in the world in 2024. Egypt sells subsidized bread to most of its people, and its wheat bill is a heavy weight on the government's budget.
- Egypt13.1
- Indonesia12.1
- China11.0
- Italy9.4
- Spain7.9
- Algeria6.9
- Philippines6.8
- Brazil6.6
- Germany6.1
- Turkey5.7
Which countries depend on wheat from Russia and Ukraine?
Lebanon, Kazakhstan, Armenia and Georgia bought more than 99% of their imported wheat from Russia and Ukraine in 2024, and Turkey 97.6%. Egypt, the largest wheat importer, bought 82.2%. Kenya, Uganda and Tanzania also buy most of their wheat from the two countries. Russia is the largest wheat exporter, with about 22% of world wheat exports in 2024/25 by FAO's estimate. Ukraine has shipped its grain through its own Black Sea corridor since August 2023. Russian attacks on Ukraine's ports increased from July 2026.
- Lebanon99.8%
- Armenia99.7%
- Kazakhstan99.7%
- Georgia99.5%
- Turkey97.6%
- Azerbaijan90.2%
- Pakistan88.9%
- Uganda84.4%
- Egypt82.2%
- Kenya81.5%
How much of its food does Japan import?
Japan imports most of its food. It produced only 37% of the calories its people ate in the year to March 2026, a record low, by the agriculture ministry's count. Japan imports about three-quarters of its grain, mostly corn for animal feed and wheat. It grows almost all of its own rice, protected by high tariffs on imported rice. A rice shortage in 2025 pushed the average price of rice in supermarkets to a record 4,285 yen for 5 kilograms in May 2025, and to 4,416 yen in January 2026.
How do the Gulf states feed themselves?
The Gulf states import most of their food. An often-quoted estimate says the six Gulf Cooperation Council states import about 85% of their food. Most of it arrived by sea through the Strait of Hormuz. Iran declared the strait closed on March 4, 2026, after American and Israeli strikes on Iran. Major ports in the United Arab Emirates, Qatar, Kuwait and Bahrain stopped or cut cargo handling. Saudi Arabia opened new supply routes from its Red Sea ports, and trucks carried food into Qatar. Kuwait froze the prices of some basic goods. In Bahrain, the retailer Lulu flew in more than 6,000 tonnes of fresh produce on 37 chartered flights.