Ranking · Energy and resources
Natural gas production by country
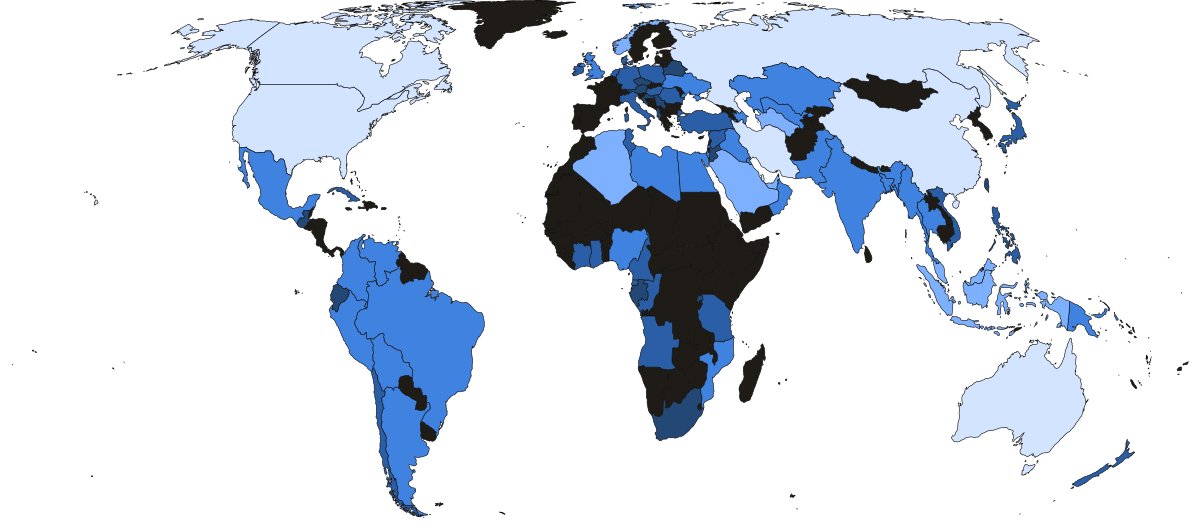
The United States produces the most natural gas: 1,069.4 billion cubic meters in 2024, 25.4% of the world's total. Russia was second with 642.0 billion, then Iran with 279.0 billion, China with 258.4 billion and Canada with 199.0 billion. These five countries produce 58% of the world's gas.
Five countries produce 58% of the world's natural gas
Share of world natural gas production, 2024
 United States 25%
 15%
7%
6%
Everyone else 42%
15%
7%
6%
Everyone else 42%
- United States 1,069.4
- Russia 642.0
- Iran 279.0
- China 258.4
- Canada 199.0
- Everyone else 1,770.5
- Under 1
- 1–10
- 10–50
- 50–150
- Over 150
- Not in this ranking
- Under 1
- 1–10
- 10–50
- 50–100
- Over 100
- Not in this ranking
- Under 1
- 1–10
- 10–50
- 50–150
- Over 150
- Not in this ranking
| # | Country | Billion m³ | Net exports | 2014 | Share of world | Change since 2014 |
|---|---|---|---|---|---|---|
| 1 | United States |
1,069.4 | 129.2 | 733.1 | 25.4% | +46% |
| 2 | Russia |
642.0 | 145.1 | 607.9 | 15.2% | +6% |
| 3 |  Iran Iran |
279.0 | 16.1 | 174.5 | 6.6% | +60% |
| 4 |  China China |
258.4 | · | 127.9 | 6.1% | +102% |
| 5 |  Canada Canada |
199.0 | 59.9 | 170.6 | 4.7% | +17% |
| 6 |  Qatar Qatar |
170.0 | 125.7 | 160.0 | 4.0% | +6% |
| 7 |  Australia Australia |
152.2 | 105.9 | 62.6 | 3.6% | +143% |
| 8 |  Norway Norway |
130.9 | 126.0 | 114.1 | 3.1% | +15% |
| 9 |  Saudi Arabia Saudi Arabia |
123.4 | · | 100.5 | 2.9% | +23% |
| 10 |  Algeria Algeria |
98.8 | 48.9 | 83.3 | 2.3% | +19% |
| 11 |  Malaysia Malaysia |
80.6 | 33.7 | 65.4 | 1.9% | +23% |
| 12 |  Turkmenistan Turkmenistan |
77.6 | 34.2 | 76.0 | 1.8% | +2% |
| 13 |  Indonesia Indonesia |
69.8 | 19.8 | 73.5 | 1.7% | −5% |
| 14 |  United Arab Emirates United Arab Emirates |
59.4 | · | 54.2 | 1.4% | +10% |
| 15 |  Egypt Egypt |
47.5 | · | 48.8 | 1.1% | −3% |
| 16 |  Argentina Argentina |
46.8 | · | 35.5 | 1.1% | +32% |
| 17 |  Uzbekistan Uzbekistan |
46.2 | · | 59.4 | 1.1% | −22% |
| 18 |  Oman Oman |
44.3 | 14.8 | 30.9 | 1.1% | +43% |
| 19 |  Nigeria Nigeria |
39.1 | 18.5 | 43.8 | 0.9% | −11% |
| 20 |  Azerbaijan Azerbaijan |
37.9 | 24.5 | 17.5 | 0.9% | +117% |
| 21 |  India India |
35.9 | · | 32.8 | 0.9% | +9% |
| 22 |  Mexico Mexico |
31.3 | · | 44.4 | 0.7% | −30% |
| 23 |  United Kingdom United Kingdom |
30.8 | · | 37.7 | 0.7% | −18% |
| 24 |  Kazakhstan Kazakhstan |
29.3 | 2.0 | 20.2 | 0.7% | +45% |
| 25 |  Thailand Thailand |
27.0 | · | 42.1 | 0.6% | −36% |
| 26 |  Israel Israel |
26.6 | 13.1 | 7.9 | 0.6% | +237% |
| 27 |  Venezuela Venezuela |
25.4 | · | 21.9 | 0.6% | +16% |
| 28 |  Trinidad and Tobago Trinidad and Tobago |
25.3 | 10.3 | 39.2 | 0.6% | −35% |
| 29 |  Pakistan Pakistan |
24.1 | · | 38.0 | 0.6% | −37% |
| 30 |  Brazil Brazil |
22.1 | · | 22.6 | 0.5% | −2% |
| 31 |  Bangladesh Bangladesh |
20.1 | · | 23.2 | 0.5% | −13% |
| 32 |  Kuwait Kuwait |
19.9 | · | 15.0 | 0.5% | +33% |
| 33 |  Bahrain Bahrain |
19.2 | · | 15.5 | 0.5% | +24% |
| 34 |  Ukraine Ukraine |
18.2 | · | 20.1 | 0.4% | −9% |
| 35 |  Peru Peru |
13.6 | 4.3 | 12.9 | 0.3% | +5% |
| 36 |  Myanmar Myanmar |
12.9 | 9.2 | 15.1 | 0.3% | −15% |
| 37 |  Mozambique Mozambique |
12.2 | 8.7 | 5.6 | 0.3% | +118% |
| 38 |  Libya Libya |
12.1 | 1.4 | 16.6 | 0.3% | −27% |
| 39 |  Papua New Guinea Papua New Guinea |
11.4 | 11.0 | 4.8 | 0.3% | +138% |
| 40 |  Bolivia Bolivia |
11.2 | 6.2 | 21.0 | 0.3% | −47% |
| 41 |  Brunei Brunei |
10.5 | 6.4 | 11.0 | 0.2% | −5% |
| 42 |  Iraq Iraq |
10.3 | · | 7.1 | 0.2% | +45% |
| 43 |  Colombia Colombia |
10.1 | · | 12.7 | 0.2% | −20% |
| 44 |  Netherlands Netherlands |
9.7 | · | 70.0 | 0.2% | −86% |
| 45 |  Romania Romania |
9.2 | · | 10.7 | 0.2% | −14% |
| 46 |  Equatorial Guinea Equatorial Guinea |
6.7 | 4.0 | 8.2 | 0.2% | −18% |
| 47 |  Vietnam Vietnam |
6.4 | · | 9.7 | 0.2% | −34% |
| 48 |  Angola Angola |
5.8 | 4.6 | 0.7 | 0.1% | +729% |
| 49 |  Poland Poland |
5.2 | · | 6.1 | 0.1% | −15% |
| 50 |  Germany Germany |
4.1 | · | 9.5 | 0.1% | −57% |
| 51 |  Syria Syria |
3.7 | · | 4.9 | 0.1% | −24% |
| 52 |  Ghana Ghana |
3.4 | · | 0.1 | 0.1% | +3,300% |
| 53 |  New Zealand New Zealand |
3.3 | · | 5.2 | 0.1% | −37% |
| 54 |  Côte d'Ivoire Côte d'Ivoire |
2.7 | · | 2.1 | 0.1% | +29% |
| 55 |  Italy Italy |
2.6 | · | 7.1 | 0.1% | −63% |
| 56 |  Cameroon Cameroon |
2.5 | 1.9 | 0.5 | 0.1% | +400% |
| 57 |  Turkey Turkey |
2.3 | · | 0.5 | 0.1% | +360% |
| 58 |  Denmark Denmark |
2.2 | 0.2 | 4.6 | 0.1% | −52% |
| 59 |  Tanzania Tanzania |
2.0 | · | 0.6 | 0.0% | +233% |
| 60 |  Japan Japan |
1.9 | · | 2.9 | 0.0% | −34% |
| 61 |  Republic of the Congo Republic of the Congo |
1.8 | 0.4 | 0.9 | 0.0% | +100% |
| 62 |  Hungary Hungary |
1.7 | · | 1.9 | 0.0% | −11% |
| 63 |  Philippines Philippines |
1.7 | · | 3.5 | 0.0% | −51% |
| 64 |  Tunisia Tunisia |
1.2 | · | 1.7 | 0.0% | −29% |
| 65 |  Ireland Ireland |
1.1 | · | 0.2 | 0.0% | +450% |
| 66 |  Chile Chile |
1.1 | · | 0.8 | 0.0% | +38% |
| 67 |  Cuba Cuba |
1.0 | · | 1.2 | 0.0% | −17% |
| 68 |  Croatia Croatia |
0.7 | · | 1.4 | 0.0% | −50% |
| 69 |  Austria Austria |
0.5 | · | 1.3 | 0.0% | −62% |
| 70 |  Gabon Gabon |
0.5 | · | 0.6 | 0.0% | −17% |
| 71 |  Ecuador Ecuador |
0.3 | · | 0.6 | 0.0% | −50% |
| 72 |  Serbia Serbia |
0.3 | · | 0.6 | 0.0% | −50% |
| 73 |  Jordan Jordan |
0.2 | · | 0.1 | 0.0% | +100% |
| 74 |  Czechia Czechia |
0.2 | · | 0.3 | 0.0% | −33% |
| 75 |  Guatemala Guatemala |
0.1 | · | 0.0 | 0.0% | New |
| 76 |  Belarus Belarus |
0.1 | · | 0.0 | 0.0% | New |
| 77 |  Albania Albania |
0.1 | · | 0.0 | 0.0% | New |
| 78 |  Taiwan Taiwan |
0.1 | · | 0.3 | 0.0% | −67% |
| 79 |  South Africa South Africa |
0.1 | · | 1.0 | 0.0% | −90% |
| 80 |  Rwanda Rwanda |
0.1 | · | 0.0 | 0.0% | New |
| # | Country | Net exports | Billion m³ | 2014 | Share of world | Change since 2014 |
|---|---|---|---|---|---|---|
| 1 | Russia |
145.1 | 642.0 | 607.9 | 15.2% | +6% |
| 2 | United States |
129.2 | 1,069.4 | 733.1 | 25.4% | +46% |
| 3 | Norway |
126.0 | 130.9 | 114.1 | 3.1% | +15% |
| 4 | Qatar |
125.7 | 170.0 | 160.0 | 4.0% | +6% |
| 5 | Australia |
105.9 | 152.2 | 62.6 | 3.6% | +143% |
| 6 | Canada |
59.9 | 199.0 | 170.6 | 4.7% | +17% |
| 7 | Algeria |
48.9 | 98.8 | 83.3 | 2.3% | +19% |
| 8 | Turkmenistan |
34.2 | 77.6 | 76.0 | 1.8% | +2% |
| 9 | Malaysia |
33.7 | 80.6 | 65.4 | 1.9% | +23% |
| 10 | Azerbaijan |
24.5 | 37.9 | 17.5 | 0.9% | +117% |
| 11 | Indonesia |
19.8 | 69.8 | 73.5 | 1.7% | −5% |
| 12 | Nigeria |
18.5 | 39.1 | 43.8 | 0.9% | −11% |
| 13 | Iran |
16.1 | 279.0 | 174.5 | 6.6% | +60% |
| 14 | Oman |
14.8 | 44.3 | 30.9 | 1.1% | +43% |
| 15 | Israel |
13.1 | 26.6 | 7.9 | 0.6% | +237% |
| 16 | Papua New Guinea |
11.0 | 11.4 | 4.8 | 0.3% | +138% |
| 17 | Trinidad and Tobago |
10.3 | 25.3 | 39.2 | 0.6% | −35% |
| 18 | Myanmar |
9.2 | 12.9 | 15.1 | 0.3% | −15% |
| 19 | Mozambique |
8.7 | 12.2 | 5.6 | 0.3% | +118% |
| 20 | Brunei |
6.4 | 10.5 | 11.0 | 0.2% | −5% |
| 21 | Bolivia |
6.2 | 11.2 | 21.0 | 0.3% | −47% |
| 22 | Angola |
4.6 | 5.8 | 0.7 | 0.1% | +729% |
| 23 | Peru |
4.3 | 13.6 | 12.9 | 0.3% | +5% |
| 24 | Equatorial Guinea |
4.0 | 6.7 | 8.2 | 0.2% | −18% |
| 25 | Kazakhstan |
2.0 | 29.3 | 20.2 | 0.7% | +45% |
| 26 | Cameroon |
1.9 | 2.5 | 0.5 | 0.1% | +400% |
| 27 | Libya |
1.4 | 12.1 | 16.6 | 0.3% | −27% |
| 28 | Republic of the Congo |
0.4 | 1.8 | 0.9 | 0.0% | +100% |
| 29 | Denmark |
0.2 | 2.2 | 4.6 | 0.1% | −52% |
| # | Country | 2014 | Billion m³ | Net exports | Share of world | Change since 2014 |
|---|---|---|---|---|---|---|
| 1 | United States |
733.1 | 1,069.4 | 129.2 | 25.4% | +46% |
| 2 | Russia |
607.9 | 642.0 | 145.1 | 15.2% | +6% |
| 3 | Iran |
174.5 | 279.0 | 16.1 | 6.6% | +60% |
| 4 | Canada |
170.6 | 199.0 | 59.9 | 4.7% | +17% |
| 5 | Qatar |
160.0 | 170.0 | 125.7 | 4.0% | +6% |
| 6 | China |
127.9 | 258.4 | · | 6.1% | +102% |
| 7 | Norway |
114.1 | 130.9 | 126.0 | 3.1% | +15% |
| 8 | Saudi Arabia |
100.5 | 123.4 | · | 2.9% | +23% |
| 9 | Algeria |
83.3 | 98.8 | 48.9 | 2.3% | +19% |
| 10 | Turkmenistan |
76.0 | 77.6 | 34.2 | 1.8% | +2% |
| 11 | Indonesia |
73.5 | 69.8 | 19.8 | 1.7% | −5% |
| 12 | Netherlands |
70.0 | 9.7 | · | 0.2% | −86% |
| 13 | Malaysia |
65.4 | 80.6 | 33.7 | 1.9% | +23% |
| 14 | Australia |
62.6 | 152.2 | 105.9 | 3.6% | +143% |
| 15 | Uzbekistan |
59.4 | 46.2 | · | 1.1% | −22% |
| 16 | United Arab Emirates |
54.2 | 59.4 | · | 1.4% | +10% |
| 17 | Egypt |
48.8 | 47.5 | · | 1.1% | −3% |
| 18 | Mexico |
44.4 | 31.3 | · | 0.7% | −30% |
| 19 | Nigeria |
43.8 | 39.1 | 18.5 | 0.9% | −11% |
| 20 | Thailand |
42.1 | 27.0 | · | 0.6% | −36% |
| 21 | Trinidad and Tobago |
39.2 | 25.3 | 10.3 | 0.6% | −35% |
| 22 | Pakistan |
38.0 | 24.1 | · | 0.6% | −37% |
| 23 | United Kingdom |
37.7 | 30.8 | · | 0.7% | −18% |
| 24 | Argentina |
35.5 | 46.8 | · | 1.1% | +32% |
| 25 | India |
32.8 | 35.9 | · | 0.9% | +9% |
| 26 | Oman |
30.9 | 44.3 | 14.8 | 1.1% | +43% |
| 27 | Bangladesh |
23.2 | 20.1 | · | 0.5% | −13% |
| 28 | Brazil |
22.6 | 22.1 | · | 0.5% | −2% |
| 29 | Venezuela |
21.9 | 25.4 | · | 0.6% | +16% |
| 30 | Bolivia |
21.0 | 11.2 | 6.2 | 0.3% | −47% |
| 31 | Kazakhstan |
20.2 | 29.3 | 2.0 | 0.7% | +45% |
| 32 | Ukraine |
20.1 | 18.2 | · | 0.4% | −9% |
| 33 | Azerbaijan |
17.5 | 37.9 | 24.5 | 0.9% | +117% |
| 34 | Libya |
16.6 | 12.1 | 1.4 | 0.3% | −27% |
| 35 | Bahrain |
15.5 | 19.2 | · | 0.5% | +24% |
| 36 | Myanmar |
15.1 | 12.9 | 9.2 | 0.3% | −15% |
| 37 | Kuwait |
15.0 | 19.9 | · | 0.5% | +33% |
| 38 | Peru |
12.9 | 13.6 | 4.3 | 0.3% | +5% |
| 39 | Colombia |
12.7 | 10.1 | · | 0.2% | −20% |
| 40 | Brunei |
11.0 | 10.5 | 6.4 | 0.2% | −5% |
| 41 | Romania |
10.7 | 9.2 | · | 0.2% | −14% |
| 42 | Vietnam |
9.7 | 6.4 | · | 0.2% | −34% |
| 43 | Germany |
9.5 | 4.1 | · | 0.1% | −57% |
| 44 | Equatorial Guinea |
8.2 | 6.7 | 4.0 | 0.2% | −18% |
| 45 | Israel |
7.9 | 26.6 | 13.1 | 0.6% | +237% |
| 46 | Iraq |
7.1 | 10.3 | · | 0.2% | +45% |
| 47 | Italy |
7.1 | 2.6 | · | 0.1% | −63% |
| 48 | Poland |
6.1 | 5.2 | · | 0.1% | −15% |
| 49 | Mozambique |
5.6 | 12.2 | 8.7 | 0.3% | +118% |
| 50 | New Zealand |
5.2 | 3.3 | · | 0.1% | −37% |
| 51 | Syria |
4.9 | 3.7 | · | 0.1% | −24% |
| 52 | Papua New Guinea |
4.8 | 11.4 | 11.0 | 0.3% | +138% |
| 53 | Denmark |
4.6 | 2.2 | 0.2 | 0.1% | −52% |
| 54 | Philippines |
3.5 | 1.7 | · | 0.0% | −51% |
| 55 | Japan |
2.9 | 1.9 | · | 0.0% | −34% |
| 56 | Côte d'Ivoire |
2.1 | 2.7 | · | 0.1% | +29% |
| 57 | Hungary |
1.9 | 1.7 | · | 0.0% | −11% |
| 58 | Tunisia |
1.7 | 1.2 | · | 0.0% | −29% |
| 59 | Croatia |
1.4 | 0.7 | · | 0.0% | −50% |
| 60 | Austria |
1.3 | 0.5 | · | 0.0% | −62% |
| 61 | Cuba |
1.2 | 1.0 | · | 0.0% | −17% |
| 62 | South Africa |
1.0 | 0.1 | · | 0.0% | −90% |
| 63 | Republic of the Congo |
0.9 | 1.8 | 0.4 | 0.0% | +100% |
| 64 | Chile |
0.8 | 1.1 | · | 0.0% | +38% |
| 65 | Angola |
0.7 | 5.8 | 4.6 | 0.1% | +729% |
| 66 | Tanzania |
0.6 | 2.0 | · | 0.0% | +233% |
| 67 | Gabon |
0.6 | 0.5 | · | 0.0% | −17% |
| 68 | Ecuador |
0.6 | 0.3 | · | 0.0% | −50% |
| 69 | Serbia |
0.6 | 0.3 | · | 0.0% | −50% |
| 70 | Cameroon |
0.5 | 2.5 | 1.9 | 0.1% | +400% |
| 71 | Turkey |
0.5 | 2.3 | · | 0.1% | +360% |
| 72 | Czechia |
0.3 | 0.2 | · | 0.0% | −33% |
| 73 | Taiwan |
0.3 | 0.1 | · | 0.0% | −67% |
| 74 | Ireland |
0.2 | 1.1 | · | 0.0% | +450% |
| 75 | Ghana |
0.1 | 3.4 | · | 0.1% | +3,300% |
| 76 | Jordan |
0.1 | 0.2 | · | 0.0% | +100% |
| 77 | Guatemala |
0.0 | 0.1 | · | 0.0% | New |
| 78 | Belarus |
0.0 | 0.1 | · | 0.0% | New |
| 79 | Albania |
0.0 | 0.1 | · | 0.0% | New |
| 80 | Rwanda |
0.0 | 0.1 | · | 0.0% | New |
Why they rank where they do
-
United States
About 78% of US gas came from shale in 2023. In 2025 three regions produced two-thirds of the total: Appalachia (the Marcellus shale), the Permian basin in Texas and New Mexico, and the Haynesville in Louisiana and Texas.
-
Russia
Explosions damaged the Nord Stream 1 and 2 pipelines under the Baltic Sea on September 26, 2022. Russian production fell from 732.6 billion cubic meters in 2021 to 597.6 billion in 2023. In 2025 China bought 38.8 billion cubic meters of Russian pipeline gas and became the biggest market for Gazprom, Russia's state-controlled gas company.
-
Iran
Iran shares the world's largest gas field with Qatar (South Pars on Iran's side, the North Field on Qatar's). Iran still runs short of gas in winter: in December 2024 schools and offices shut to save gas. On March 18, 2026, Israel struck South Pars processing plants, and reports said the strike halted about 12% of Iran's gas output.
-
China
China was the world's largest LNG importer in 2025, just ahead of Japan. Imports met about 42% of the gas China used in 2024.
-
Canada
In 2024, 99.9% of Canada's gas exports went by pipeline to the United States. LNG Canada at Kitimat, British Columbia, shipped Canada's first large LNG cargo on June 30, 2025, bound for South Korea.
-
Qatar
All of Qatar's LNG leaves by sea through the Strait of Hormuz. QatarEnergy shut its Ras Laffan LNG plants on March 2, 2026, after an Iranian drone attack. An Iranian missile attack on March 18 damaged units that make 17% of Qatar's LNG, and QatarEnergy says repairs will take three years. Two LNG tankers were struck in the strait in July, and by early September 2026 Qatar's shipments had almost stopped.
-
Australia
In December 2025 Australia's government decided that from July 1, 2027, 20% of LNG export volumes from the east coast must be offered to Australian buyers. The competition regulator had warned that east-coast supply could fall short of demand from 2028.
-
Norway
Norway sells almost all of its gas abroad, most of it by pipeline. Including LNG, Norway covers more than 30% of Europe's gas use.
-
Saudi Arabia
Saudi Arabia neither exports nor imports gas. It uses all the gas it produces at home.
-
Algeria
Algeria supplied 17.4% of the EU's pipeline gas imports in 2025, second after Norway.
-
Turkmenistan
Turkmenistan has the fourth-largest proven gas reserves in the world by Energy Institute figures. China is Turkmenistan's main buyer, through three pipelines across Central Asia.
-
Egypt
The Italian company Eni found the Zohr field off Egypt on August 30, 2015, the largest gas find ever made in the Mediterranean. Zohr let Egypt largely stop importing LNG in 2018. Zohr's output then fell, and Egypt started buying LNG again in 2024.
-
Israel
Israel's offshore fields Leviathan and Tamar supply Egypt and Jordan. On August 7, 2025, Leviathan's partners agreed to sell 130 billion cubic meters of gas to Egypt through 2040, for about $35 billion, Israel's largest export deal. Israel shut Leviathan on February 28, 2026, when the war with Iran began, and restarted the field on April 3 after 32 days.
-
Netherlands
The Groningen field earned the Dutch state about €363 billion from the 1960s until it closed.
Which countries export the most natural gas?
Russia is the largest net exporter of natural gas, with 145.1 billion cubic meters more exported than imported in 2024. The United States is second with 129.2 billion, followed by Norway with 126.0 billion and Qatar with 125.7 billion. Gas travels by pipeline or as LNG (liquefied natural gas). LNG is gas cooled to about minus 162°C. As a liquid it takes up about 600 times less space, so ships can carry it across oceans.
The United States has been the world's largest LNG exporter since 2023. US gross exports in 2024 were 218.2 billion cubic meters, but the United States also imported 89.1 billion, mostly by pipeline from Canada. In all, 29 countries sell more gas abroad than they buy.
- Russia145.1
- United States129.2
- Norway126.0
- Qatar125.7
- Australia105.9
- Canada59.9
- Algeria48.9
- Turkmenistan34.2
Which countries have increased gas production the most?
Australia's gas production rose 143% from 2014 to 2024, from 62.6 to 152.2 billion cubic meters. Most of the new gas is exported as LNG, including from three plants at Gladstone in Queensland. China's production rose 102%, Iran's 60% and America's 46%, from 733.1 to 1,069.4 billion cubic meters, driven by shale.
Argentina's production rose 32%. The Vaca Muerta shale formation produced over 70% of Argentina's gas by September 2024. Argentina began sending gas to Brazil through Bolivia on April 1, 2025, but Argentina still imports LNG in winter.
- Australia+143%
- China+102%
- Iran+60%
- United States+46%
- Kazakhstan+45%
- Oman+43%
- Argentina+32%
- Malaysia+23%
Change in natural gas production, 2014 to 2024. Countries that produced at least 20 billion cubic meters in 2014.
Which countries' gas production has fallen the most?
The Netherlands' gas production fell 86% from 2014 to 2024, from 70.0 to 9.7 billion cubic meters. Gas extraction at the Groningen field caused more than 1,600 earthquakes over 40 years and damaged about 85,000 buildings. Normal production ended in October 2023, and the Dutch Senate voted on April 16, 2024 to close the field for good.
Bolivia's production fell 47%. Bolivia's earnings from gas exports dropped from $6.0 billion in 2014 to $1.1 billion in 2025, and Argentina stopped buying Bolivian gas in September 2024. Mexico's production fell 30%, and pipeline gas from the United States covered about 74% of Mexico's gas use in 2024. The United Kingdom's fell 18%. UK gas production peaked in 2000, and in 2025 it was the lowest since 1973.
- Netherlands−86%
- Bolivia−47%
- Pakistan−37%
- Thailand−36%
- Trinidad and Tobago−35%
- Mexico−30%
- Uzbekistan−22%
- United Kingdom−18%
Change in natural gas production, 2014 to 2024. Countries that produced at least 20 billion cubic meters in 2014.
Where does Europe get its gas?
Norway is now the European Union's largest supplier, with 52.1% of the pipeline gas the EU imported in 2025. The United States supplied 56% of the EU's LNG. Russia supplied 45% of the EU's gas imports in 2021, 19% in 2024 and 12% in 2025. Gas transit through Ukraine ended on January 1, 2025. Since then Russian pipeline gas has reached the EU only through TurkStream, under the Black Sea. An EU law in force since February 3, 2026 bans Russian LNG from January 1, 2027 and Russian pipeline gas by November 1, 2027 at the latest.
About 20% of the world's LNG trade passed through the Strait of Hormuz in 2024. After Iranian attacks shut Qatar's LNG plants in March 2026, Qatar's share of the EU's LNG imports fell from 10.1% at the end of 2025 to 0.3% in the second quarter of 2026. The US share rose to 63.2%.