
Ranking · Energy and resources
Oil production by country
The United States is the world's largest oil producer, with 13.6 million barrels of crude a day in 2025. Russia was second at 9.9 million and Saudi Arabia third at 9.6 million. With Canada and Iraq, these five countries produce half of the world's crude.
Where the world's 84.4 million barrels a day come from
Share of world crude oil production, 2025
 16%
16%
 12%
12%
 11%
6%
5%
Everyone else 50%
11%
6%
5%
Everyone else 50%
- United States 13,586,000
- Russia 9,885,000
- Saudi Arabia 9,556,000
- Canada 4,964,000
- Iraq 4,388,000
- Everyone else 42,004,000
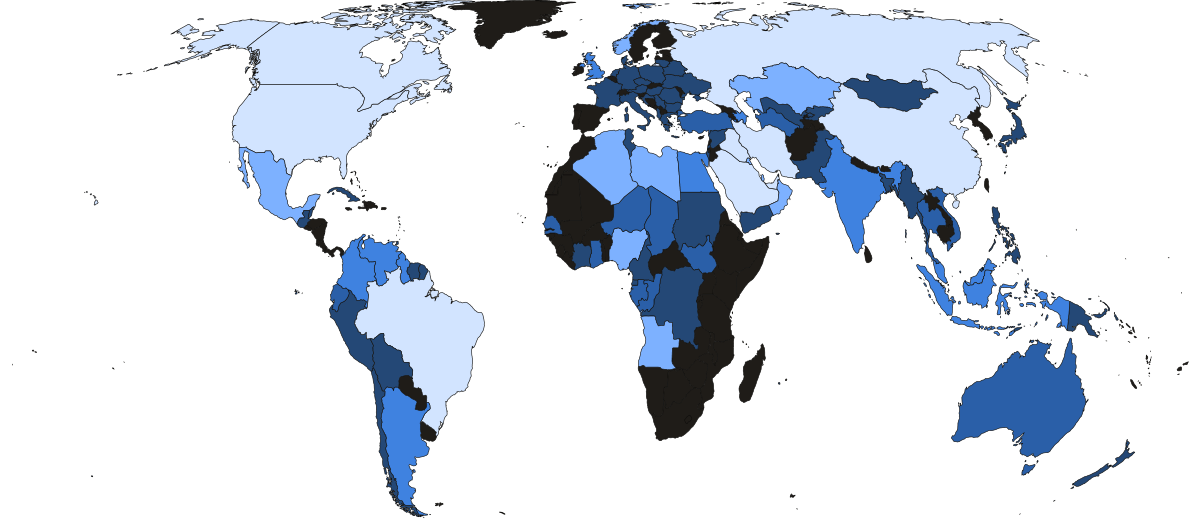
- Under 100,000
- 100,000–500,000
- 500,000–1 million
- 1 million–3 million
- Over 3 million
- Not in this ranking
- Under 100,000
- 100,000–500,000
- 500,000–1 million
- 1 million–3 million
- Over 3 million
- Not in this ranking
| # | Country | Barrels a day | 2015 | Share of world | Change since 2015 |
|---|---|---|---|---|---|
| 1 | United States |
13,586,000 | 9,446,000 | 16.1% | +44% |
| 2 | Russia |
9,885,000 | 10,253,000 | 11.7% | −4% |
| 3 | Saudi Arabia |
9,556,000 | 10,336,000 | 11.3% | −8% |
| 4 |  Canada Canada |
4,964,000 | 3,677,000 | 5.9% | +35% |
| 5 |  Iraq Iraq |
4,388,000 | 4,055,000 | 5.2% | +8% |
| 6 |  China China |
4,325,000 | 4,278,000 | 5.1% | +1% |
| 7 |  Iran Iran |
4,051,000 | 3,293,000 | 4.8% | +23% |
| 8 |  United Arab Emirates United Arab Emirates |
3,771,000 | 3,149,000 | 4.5% | +20% |
| 9 |  Brazil Brazil |
3,769,000 | 2,437,000 | 4.5% | +55% |
| 10 |  Kuwait Kuwait |
2,584,000 | 2,859,000 | 3.1% | −10% |
| 11 |  Kazakhstan Kazakhstan |
2,047,000 | 1,653,000 | 2.4% | +24% |
| 12 |  Norway Norway |
1,858,000 | 1,610,000 | 2.2% | +15% |
| 13 |  Mexico Mexico |
1,726,000 | 2,302,000 | 2.0% | −25% |
| 14 |  Nigeria Nigeria |
1,605,000 | 2,171,000 | 1.9% | −26% |
| 15 |  Libya Libya |
1,363,000 | 464,000 | 1.6% | +194% |
| 16 |  Qatar Qatar |
1,297,000 | 1,356,000 | 1.5% | −4% |
| 17 |  Algeria Algeria |
1,143,000 | 1,429,000 | 1.4% | −20% |
| 18 |  Angola Angola |
1,031,000 | 1,802,000 | 1.2% | −43% |
| 19 |  Oman Oman |
1,002,000 | 981,000 | 1.2% | +2% |
| 20 |  Venezuela Venezuela |
973,000 | 2,489,000 | 1.2% | −61% |
| 21 |  Argentina Argentina |
794,000 | 532,000 | 0.9% | +49% |
| 22 |  Guyana Guyana |
747,000 | 0 | 0.9% | New |
| 23 |  Colombia Colombia |
746,000 | 1,003,000 | 0.9% | −26% |
| 24 |  United Kingdom United Kingdom |
616,000 | 893,000 | 0.7% | −31% |
| 25 |  Indonesia Indonesia |
582,000 | 786,000 | 0.7% | −26% |
| 26 |  India India |
581,000 | 764,000 | 0.7% | −24% |
| 27 |  Azerbaijan Azerbaijan |
561,000 | 848,000 | 0.7% | −34% |
| 28 |  Malaysia Malaysia |
513,000 | 654,000 | 0.6% | −22% |
| 29 |  Egypt Egypt |
505,000 | 682,000 | 0.6% | −26% |
| 30 |  Ecuador Ecuador |
441,000 | 543,000 | 0.5% | −19% |
| 31 |  Australia Australia |
246,000 | 322,000 | 0.3% | −24% |
| 32 |  Republic of the Congo Republic of the Congo |
241,000 | 238,000 | 0.3% | +1% |
| 33 |  Gabon Gabon |
239,000 | 213,000 | 0.3% | +12% |
| 34 |  Turkmenistan Turkmenistan |
191,000 | 243,000 | 0.2% | −21% |
| 35 |  Ghana Ghana |
183,000 | 102,000 | 0.2% | +79% |
| 36 |  Bahrain Bahrain |
176,000 | 202,000 | 0.2% | −13% |
| 37 |  Vietnam Vietnam |
165,000 | 333,000 | 0.2% | −50% |
| 38 |  Thailand Thailand |
162,000 | 248,000 | 0.2% | −35% |
| 39 |  Chad Chad |
126,000 | 123,000 | 0.1% | +2% |
| 40 |  Turkey Turkey |
125,000 | 49,000 | 0.1% | +155% |
| 41 |  South Sudan South Sudan |
113,000 | 153,000 | 0.1% | −26% |
| 42 |  Niger Niger |
101,000 | 14,000 | 0.1% | +621% |
| 43 |  Brunei Brunei |
101,000 | 115,000 | 0.1% | −12% |
| 44 |  Senegal Senegal |
100,000 | 0 | 0.1% | New |
| 45 |  Italy Italy |
84,000 | 100,000 | 0.1% | −16% |
| 46 |  Equatorial Guinea Equatorial Guinea |
76,000 | 250,000 | 0.1% | −70% |
| 47 |  Syria Syria |
75,000 | 19,000 | 0.1% | +295% |
| 48 |  Denmark Denmark |
72,000 | 156,000 | 0.1% | −54% |
| 49 |  Cameroon Cameroon |
59,000 | 98,000 | 0.1% | −40% |
| 50 |  Pakistan Pakistan |
58,000 | 90,000 | 0.1% | −36% |
| 51 |  Côte d'Ivoire Côte d'Ivoire |
55,000 | 30,000 | 0.1% | +83% |
| 52 |  Romania Romania |
52,000 | 83,000 | 0.1% | −37% |
| 53 |  Trinidad and Tobago Trinidad and Tobago |
51,000 | 79,000 | 0.1% | −35% |
| 54 |  Peru Peru |
44,000 | 58,000 | 0.1% | −24% |
| 55 |  Germany Germany |
32,000 | 48,000 | 0.0% | −33% |
| 56 |  Papua New Guinea Papua New Guinea |
32,000 | 58,000 | 0.0% | −45% |
| 57 |  Ukraine Ukraine |
31,000 | 36,000 | 0.0% | −14% |
| 58 |  Uzbekistan Uzbekistan |
30,000 | 52,000 | 0.0% | −42% |
| 59 |  Sudan Sudan |
30,000 | 108,000 | 0.0% | −72% |
| 60 |  Belarus Belarus |
26,000 | 26,000 | 0.0% | 0% |
| 61 |  Tunisia Tunisia |
25,000 | 36,000 | 0.0% | −31% |
| 62 |  Cuba Cuba |
25,000 | 49,000 | 0.0% | −49% |
| 63 |  Hungary Hungary |
23,000 | 12,000 | 0.0% | +92% |
| 64 |  Netherlands Netherlands |
21,000 | 27,000 | 0.0% | −22% |
| 65 |  Israel Israel |
20,000 | 0 | 0.0% | New |
| 66 |  Bolivia Bolivia |
18,000 | 49,000 | 0.0% | −63% |
| 67 |  Poland Poland |
17,000 | 19,000 | 0.0% | −11% |
| 68 |  DR Congo DR Congo |
16,000 | 20,000 | 0.0% | −20% |
| 69 |  Yemen Yemen |
15,000 | 32,000 | 0.0% | −53% |
| 70 |  Mongolia Mongolia |
14,000 | 23,000 | 0.0% | −39% |
| 71 |  Suriname Suriname |
12,000 | 16,000 | 0.0% | −25% |
| 72 |  Albania Albania |
12,000 | 23,000 | 0.0% | −48% |
| 73 |  Serbia Serbia |
11,000 | 20,000 | 0.0% | −45% |
| 74 |  France France |
10,000 | 17,000 | 0.0% | −41% |
| 75 |  Austria Austria |
9,000 | 16,000 | 0.0% | −44% |
| 76 |  Croatia Croatia |
9,000 | 12,000 | 0.0% | −25% |
| 77 |  New Zealand New Zealand |
8,000 | 41,000 | 0.0% | −80% |
| 78 |  Myanmar Myanmar |
6,000 | 11,000 | 0.0% | −45% |
| 79 |  Kyrgyzstan Kyrgyzstan |
6,000 | 1,000 | 0.0% | +500% |
| 80 |  Guatemala Guatemala |
5,000 | 10,000 | 0.0% | −50% |
| 81 |  Japan Japan |
3,000 | 4,000 | 0.0% | −25% |
| 82 |  Bangladesh Bangladesh |
3,000 | 4,000 | 0.0% | −25% |
| 83 |  Timor-Leste Timor-Leste |
2,000 | 45,000 | 0.0% | −96% |
| 84 |  Chile Chile |
2,000 | 6,000 | 0.0% | −67% |
| 85 |  Barbados Barbados |
1,000 | 1,000 | 0.0% | 0% |
| 86 |  Lithuania Lithuania |
1,000 | 2,000 | 0.0% | −50% |
| 87 |  Greece Greece |
1,000 | 1,000 | 0.0% | 0% |
| 88 |  Czechia Czechia |
1,000 | 3,000 | 0.0% | −67% |
| 89 |  Philippines Philippines |
1,000 | 24,000 | 0.0% | −96% |
| 90 |  Bulgaria Bulgaria |
1,000 | 1,000 | 0.0% | 0% |
| 91 |  Belize Belize |
1,000 | 2,000 | 0.0% | −50% |
| # | Country | 2015 | Barrels a day | Share of world | Change since 2015 |
|---|---|---|---|---|---|
| 1 | Saudi Arabia |
10,336,000 | 9,556,000 | 11.3% | −8% |
| 2 | Russia |
10,253,000 | 9,885,000 | 11.7% | −4% |
| 3 | United States |
9,446,000 | 13,586,000 | 16.1% | +44% |
| 4 | China |
4,278,000 | 4,325,000 | 5.1% | +1% |
| 5 | Iraq |
4,055,000 | 4,388,000 | 5.2% | +8% |
| 6 | Canada |
3,677,000 | 4,964,000 | 5.9% | +35% |
| 7 | Iran |
3,293,000 | 4,051,000 | 4.8% | +23% |
| 8 | United Arab Emirates |
3,149,000 | 3,771,000 | 4.5% | +20% |
| 9 | Kuwait |
2,859,000 | 2,584,000 | 3.1% | −10% |
| 10 | Venezuela |
2,489,000 | 973,000 | 1.2% | −61% |
| 11 | Brazil |
2,437,000 | 3,769,000 | 4.5% | +55% |
| 12 | Mexico |
2,302,000 | 1,726,000 | 2.0% | −25% |
| 13 | Nigeria |
2,171,000 | 1,605,000 | 1.9% | −26% |
| 14 | Angola |
1,802,000 | 1,031,000 | 1.2% | −43% |
| 15 | Kazakhstan |
1,653,000 | 2,047,000 | 2.4% | +24% |
| 16 | Norway |
1,610,000 | 1,858,000 | 2.2% | +15% |
| 17 | Algeria |
1,429,000 | 1,143,000 | 1.4% | −20% |
| 18 | Qatar |
1,356,000 | 1,297,000 | 1.5% | −4% |
| 19 | Colombia |
1,003,000 | 746,000 | 0.9% | −26% |
| 20 | Oman |
981,000 | 1,002,000 | 1.2% | +2% |
| 21 | United Kingdom |
893,000 | 616,000 | 0.7% | −31% |
| 22 | Azerbaijan |
848,000 | 561,000 | 0.7% | −34% |
| 23 | Indonesia |
786,000 | 582,000 | 0.7% | −26% |
| 24 | India |
764,000 | 581,000 | 0.7% | −24% |
| 25 | Egypt |
682,000 | 505,000 | 0.6% | −26% |
| 26 | Malaysia |
654,000 | 513,000 | 0.6% | −22% |
| 27 | Ecuador |
543,000 | 441,000 | 0.5% | −19% |
| 28 | Argentina |
532,000 | 794,000 | 0.9% | +49% |
| 29 | Libya |
464,000 | 1,363,000 | 1.6% | +194% |
| 30 | Vietnam |
333,000 | 165,000 | 0.2% | −50% |
| 31 | Australia |
322,000 | 246,000 | 0.3% | −24% |
| 32 | Equatorial Guinea |
250,000 | 76,000 | 0.1% | −70% |
| 33 | Thailand |
248,000 | 162,000 | 0.2% | −35% |
| 34 | Turkmenistan |
243,000 | 191,000 | 0.2% | −21% |
| 35 | Republic of the Congo |
238,000 | 241,000 | 0.3% | +1% |
| 36 | Gabon |
213,000 | 239,000 | 0.3% | +12% |
| 37 | Bahrain |
202,000 | 176,000 | 0.2% | −13% |
| 38 | Denmark |
156,000 | 72,000 | 0.1% | −54% |
| 39 | South Sudan |
153,000 | 113,000 | 0.1% | −26% |
| 40 | Chad |
123,000 | 126,000 | 0.1% | +2% |
| 41 | Brunei |
115,000 | 101,000 | 0.1% | −12% |
| 42 | Sudan |
108,000 | 30,000 | 0.0% | −72% |
| 43 | Ghana |
102,000 | 183,000 | 0.2% | +79% |
| 44 | Italy |
100,000 | 84,000 | 0.1% | −16% |
| 45 | Cameroon |
98,000 | 59,000 | 0.1% | −40% |
| 46 | Pakistan |
90,000 | 58,000 | 0.1% | −36% |
| 47 | Romania |
83,000 | 52,000 | 0.1% | −37% |
| 48 | Trinidad and Tobago |
79,000 | 51,000 | 0.1% | −35% |
| 49 | Peru |
58,000 | 44,000 | 0.1% | −24% |
| 50 | Papua New Guinea |
58,000 | 32,000 | 0.0% | −45% |
| 51 | Uzbekistan |
52,000 | 30,000 | 0.0% | −42% |
| 52 | Turkey |
49,000 | 125,000 | 0.1% | +155% |
| 53 | Cuba |
49,000 | 25,000 | 0.0% | −49% |
| 54 | Bolivia |
49,000 | 18,000 | 0.0% | −63% |
| 55 | Germany |
48,000 | 32,000 | 0.0% | −33% |
| 56 | Timor-Leste |
45,000 | 2,000 | 0.0% | −96% |
| 57 | New Zealand |
41,000 | 8,000 | 0.0% | −80% |
| 58 | Ukraine |
36,000 | 31,000 | 0.0% | −14% |
| 59 | Tunisia |
36,000 | 25,000 | 0.0% | −31% |
| 60 | Yemen |
32,000 | 15,000 | 0.0% | −53% |
| 61 | Côte d'Ivoire |
30,000 | 55,000 | 0.1% | +83% |
| 62 | Netherlands |
27,000 | 21,000 | 0.0% | −22% |
| 63 | Belarus |
26,000 | 26,000 | 0.0% | 0% |
| 64 | Philippines |
24,000 | 1,000 | 0.0% | −96% |
| 65 | Mongolia |
23,000 | 14,000 | 0.0% | −39% |
| 66 | Albania |
23,000 | 12,000 | 0.0% | −48% |
| 67 | DR Congo |
20,000 | 16,000 | 0.0% | −20% |
| 68 | Serbia |
20,000 | 11,000 | 0.0% | −45% |
| 69 | Syria |
19,000 | 75,000 | 0.1% | +295% |
| 70 | Poland |
19,000 | 17,000 | 0.0% | −11% |
| 71 | France |
17,000 | 10,000 | 0.0% | −41% |
| 72 | Suriname |
16,000 | 12,000 | 0.0% | −25% |
| 73 | Austria |
16,000 | 9,000 | 0.0% | −44% |
| 74 | Niger |
14,000 | 101,000 | 0.1% | +621% |
| 75 | Hungary |
12,000 | 23,000 | 0.0% | +92% |
| 76 | Croatia |
12,000 | 9,000 | 0.0% | −25% |
| 77 | Myanmar |
11,000 | 6,000 | 0.0% | −45% |
| 78 | Guatemala |
10,000 | 5,000 | 0.0% | −50% |
| 79 | Chile |
6,000 | 2,000 | 0.0% | −67% |
| 80 | Japan |
4,000 | 3,000 | 0.0% | −25% |
| 81 | Bangladesh |
4,000 | 3,000 | 0.0% | −25% |
| 82 | Czechia |
3,000 | 1,000 | 0.0% | −67% |
| 83 | Lithuania |
2,000 | 1,000 | 0.0% | −50% |
| 84 | Belize |
2,000 | 1,000 | 0.0% | −50% |
| 85 | Kyrgyzstan |
1,000 | 6,000 | 0.0% | +500% |
| 86 | Barbados |
1,000 | 1,000 | 0.0% | 0% |
| 87 | Greece |
1,000 | 1,000 | 0.0% | 0% |
| 88 | Bulgaria |
1,000 | 1,000 | 0.0% | 0% |
| 89 | Guyana |
0 | 747,000 | 0.9% | New |
| 90 | Senegal |
0 | 100,000 | 0.1% | New |
| 91 | Israel |
0 | 20,000 | 0.0% | New |
Why they rank where they do
-
United States
US output was 5.0 million barrels a day in 2008. The shale boom nearly tripled it, and no country has ever produced more in EIA records.
-
Russia
After Russia invaded Ukraine in 2022, Western countries banned or capped purchases of Russian oil. Russia now sells most of its crude to India and China, much of it carried by old tankers with murky ownership and insurance.
-
Saudi Arabia
Saudi Arabia has the lowest production costs in the world, a few dollars a barrel. It keeps about 2 million barrels a day of capacity unused on purpose, which lets it move world prices by opening or closing the taps.
-
Canada
Most Canadian oil comes from the Alberta oil sands. Until the Trans Mountain pipeline expansion opened in May 2024, nearly all Canadian oil exports had to go to the United States.
-
China
China is also the world's largest crude oil importer, buying 11.7 million barrels a day in February 2026. Most of Iran's oil goes to China despite US sanctions reimposed in 2018.
-
United Arab Emirates
The United Arab Emirates left OPEC and OPEC+ on May 1, 2026, after 59 years of membership and years of disputes with Saudi Arabia over how much the UAE was allowed to pump.
-
Kazakhstan
A Chevron-led expansion of the giant Tengiz field pushed output well above Kazakhstan's OPEC+ quota. Most Kazakh oil flows through one pipeline across Russia to the Black Sea, and Ukrainian drones have hit that pipeline's facilities.
-
Norway
Norway saved its oil money in a state fund that is now the largest sovereign wealth fund in the world. Norway's output peaked at 3.2 million barrels a day in 2001.
-
Venezuela
Venezuela has the largest proven oil reserves in the world. On January 3, 2026, American forces seized President Nicolás Maduro in Caracas and flew him to New York to face trial.
-
Guyana
With about 836,000 people, Guyana now pumps more oil per person than any other country, almost twice as much as Kuwait. Venezuela claims the Essequibo region, about two-thirds of Guyana's territory.
Which countries have increased oil production the most?
Brazil increased its oil production by 55% between 2015 and 2025, the most of any country that produced at least 500,000 barrels a day in 2015. Argentina's output rose 49% and America's 44%. Together, five producers in the Americas, the United States, Canada, Brazil, Argentina and Guyana, added 7.8 million barrels a day. World output rose by only 3.4 million, so the rest of the world together produced less in 2025 than in 2015. Guyana is not in the chart because it produced no oil in 2015. Its first oil flowed in December 2019, from fields found by an ExxonMobil-led group.
- Brazil+55%
- Argentina+49%
- United States+44%
- Canada+35%
- Kazakhstan+24%
- Iran+23%
- United Arab Emirates+20%
- Norway+15%
Change in crude oil production, 2015 to 2025. Countries that produced at least 500,000 barrels a day in 2015.
Which countries' oil production has fallen the most?
Venezuela's production fell 61% between 2015 and 2025, the largest drop of any major producer. Venezuela pumped 3.1 million barrels a day in 1998 and only 973,000 in 2025, after decades of mismanagement at the state company PDVSA and years of US sanctions. Angola's output fell 43%, and Angola left OPEC at the start of 2024 after a dispute over its quota. The United Kingdom's fell 31% as North Sea fields ran down. Mexico's fell 25%. Mexican output peaked in 2004, when the giant Cantarell field was at its height, and the state company Pemex is now the most indebted oil company in the world.
- Venezuela−61%
- Angola−43%
- Azerbaijan−34%
- United Kingdom−31%
- Nigeria−26%
- Indonesia−26%
- Egypt−26%
- Colombia−26%
Change in crude oil production, 2015 to 2025. Countries that produced at least 500,000 barrels a day in 2015.
How much of the world's oil does OPEC produce?
OPEC's 11 members produced 26.2 million barrels of crude a day in 2025, 31% of the world total. The United States alone produced 16%. Iran, Iraq, Kuwait, Saudi Arabia and Venezuela founded OPEC in Baghdad in 1960. Its members today are Algeria, the Republic of the Congo, Equatorial Guinea, Gabon, Iran, Iraq, Kuwait, Libya, Nigeria, Saudi Arabia and Venezuela. Qatar left OPEC in 2019, Angola in 2024 and the United Arab Emirates in 2026.
How much oil goes through the Strait of Hormuz?
About a fifth of the world's oil passed through the Strait of Hormuz before the 2026 war, about 20 million barrels a day in 2024. Iran declared the strait closed on March 4, 2026, after American and Israeli strikes killed Iran's supreme leader, Ali Khamenei. Kuwait, Qatar and Bahrain have no way to export oil except through the strait. Saudi Arabia can send part of its oil by pipeline across the country to the Red Sea, and the United Arab Emirates by pipeline to Fujairah. Iraq has no such route. Oil pays for about 90% of the Iraqi government's budget, and nearly all Iraqi exports leave from Basra through the strait.
Read more
-
 Blog
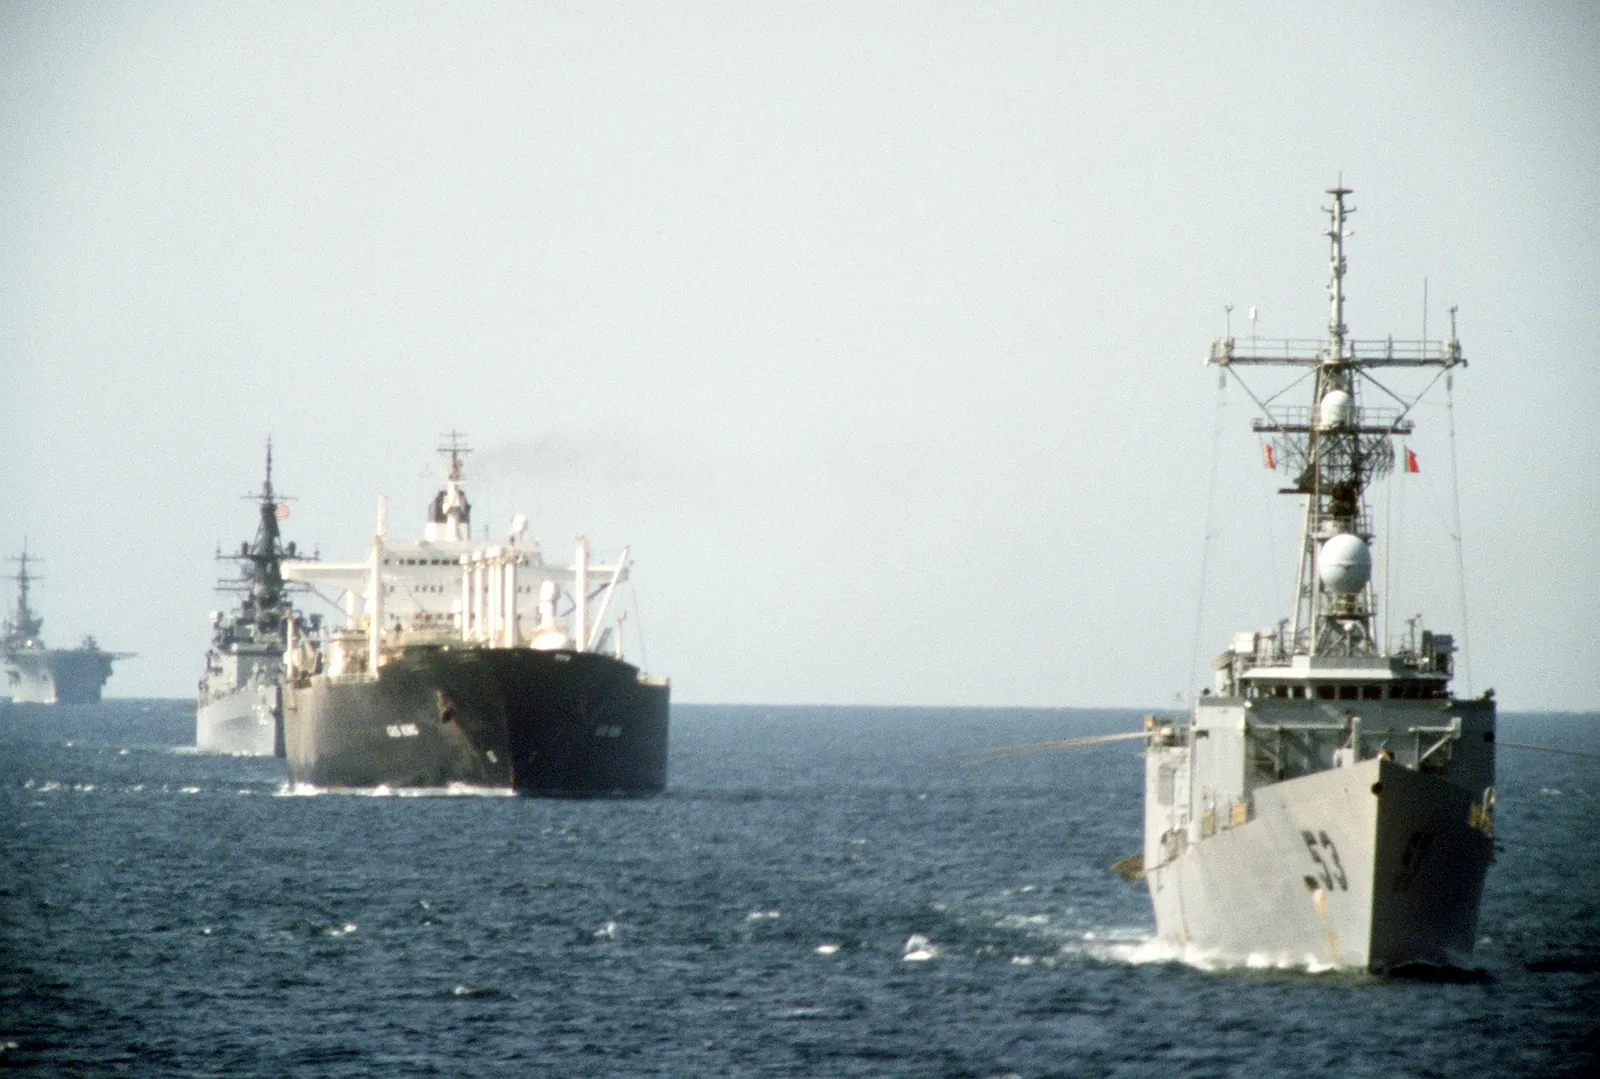
Why is the Strait of Hormuz so hard to reopen?
Five months after Iran closed the strait, the strongest navy on earth still cannot get the oil moving. The reasons are mines, escort math, and insurance.
Blog
Why is the Strait of Hormuz so hard to reopen?
Five months after Iran closed the strait, the strongest navy on earth still cannot get the oil moving. The reasons are mines, escort math, and insurance.
-
 Blog
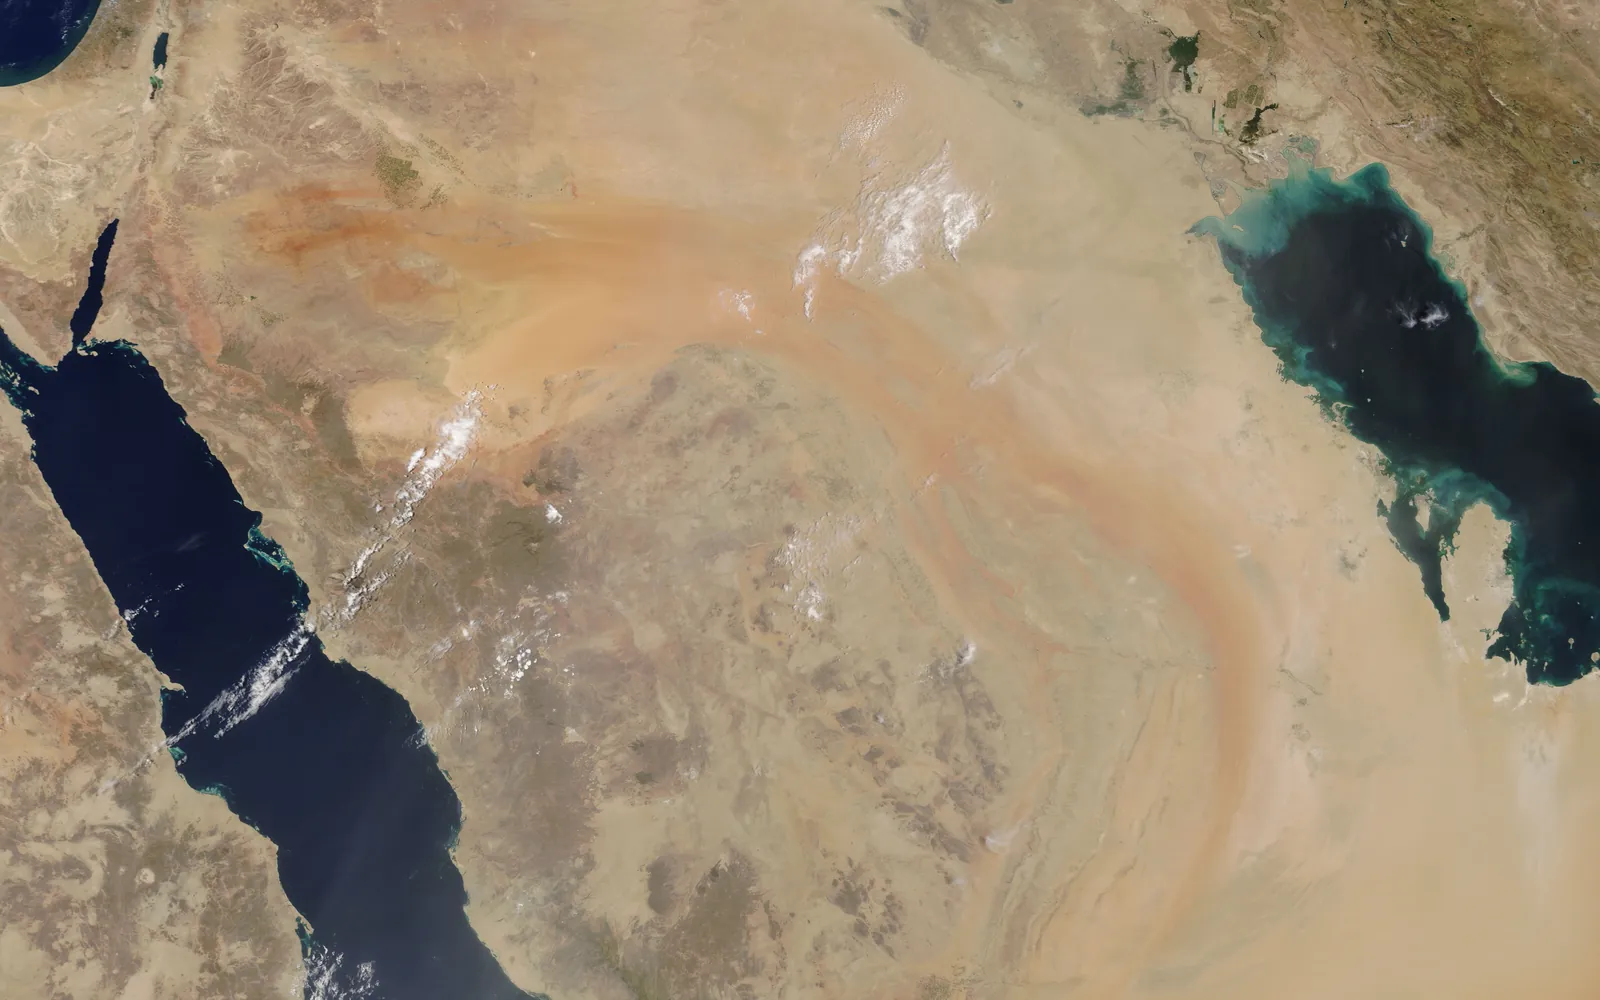
The Geopolitics of Saudi Arabia
Oil, Mecca, and one ruling family. How Saudi Arabia became the swing power of the Middle East, and why 2026 is testing everything it built.
Blog
The Geopolitics of Saudi Arabia
Oil, Mecca, and one ruling family. How Saudi Arabia became the swing power of the Middle East, and why 2026 is testing everything it built.