
Ranking · Economy
GDP by country
The United States had the largest economy in 2025, producing $30.8 trillion in goods and services. China was second at $19.6 trillion. Germany, Japan and the United Kingdom completed the top five. The world economy reached about $118 trillion, and the United States and China together accounted for about 43% of it.
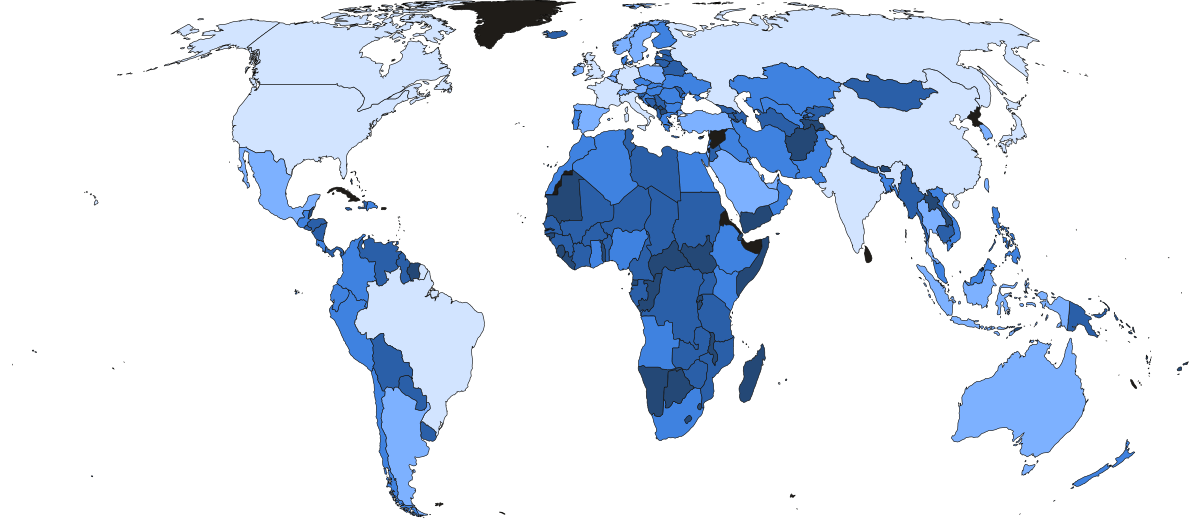
- Under $20bn
- $20bn–$100bn
- $100bn–$500bn
- $500bn–$2tn
- Over $2tn
- Not in this ranking
- Under $2tn
- $2tn–$4tn
- $4tn–$10tn
- $10tn–$20tn
- Over $20tn
- Not in this ranking
| # | Country | GDP 2025 | 2050 forecast |
|---|---|---|---|
| 1 |  United States United States |
$30.8tn | $37.2tn |
| 2 |  China China |
$19.6tn | $41.9tn |
| 3 |  Germany Germany |
$5.05tn | $6.20tn |
| 4 |  Japan Japan |
$4.44tn | $6.00tn |
| 5 |  United Kingdom United Kingdom |
$4.00tn | $5.20tn |
| 6 |  India India |
$3.92tn | $22.2tn |
| 7 |  France France |
$3.37tn | $4.60tn |
| 8 |  Russia Russia |
$2.59tn | $4.50tn |
| 9 |  Italy Italy |
$2.55tn | · |
| 10 |  Canada Canada |
$2.32tn | $3.40tn |
| 11 |  Brazil Brazil |
$2.28tn | $4.90tn |
| 12 |  Spain Spain |
$1.90tn | · |
| 13 |  South Korea South Korea |
$1.87tn | · |
| 14 |  Australia Australia |
$1.84tn | · |
| 15 |  Mexico Mexico |
$1.83tn | $4.20tn |
| 16 |  Turkey Turkey |
$1.60tn | · |
| 17 |  Indonesia Indonesia |
$1.45tn | $6.30tn |
| 18 |  Netherlands Netherlands |
$1.33tn | · |
| 19 |  Saudi Arabia Saudi Arabia |
$1.28tn | $3.50tn |
| 20 |  Switzerland Switzerland |
$1.04tn | · |
| 21 |  Poland Poland |
$1.04tn | · |
| 22 |  Taiwan Taiwan |
$920bn | · |
| 23 |  Belgium Belgium |
$725bn | · |
| 24 |  Ireland Ireland |
$718bn | · |
| 25 |  Argentina Argentina |
$681bn | · |
| 26 |  Sweden Sweden |
$669bn | · |
| 27 |  Israel Israel |
$611bn | · |
| 28 |  Singapore Singapore |
$604bn | · |
| 29 |  Austria Austria |
$580bn | · |
| 30 |  Thailand Thailand |
$577bn | · |
| 31 |  United Arab Emirates United Arab Emirates |
$572bn | · |
| 32 |  Norway Norway |
$531bn | · |
| 33 |  Vietnam Vietnam |
$494bn | · |
| 34 |  Philippines Philippines |
$487bn | · |
| 35 |  Malaysia Malaysia |
$472bn | · |
| 36 |  Denmark Denmark |
$462bn | · |
| 37 |  Bangladesh Bangladesh |
$458bn | · |
| 38 |  Colombia Colombia |
$457bn | · |
| 39 |  Romania Romania |
$428bn | · |
| 40 |  South Africa South Africa |
$427bn | · |
| 41 |  Pakistan Pakistan |
$408bn | · |
| 42 |  Czechia Czechia |
$389bn | · |
| 43 |  Iran Iran |
$371bn | · |
| 44 |  Egypt Egypt |
$365bn | $3.50tn |
| 45 |  Chile Chile |
$355bn | · |
| 46 |  Portugal Portugal |
$346bn | · |
| 47 |  Peru Peru |
$341bn | · |
| 48 |  Finland Finland |
$317bn | · |
| 49 |  Kazakhstan Kazakhstan |
$303bn | · |
| 50 |  Nigeria Nigeria |
$290bn | $3.40tn |
| 51 |  Algeria Algeria |
$286bn | · |
| 52 |  Greece Greece |
$280bn | · |
| 53 |  Iraq Iraq |
$264bn | · |
| 54 |  New Zealand New Zealand |
$259bn | · |
| 55 |  Hungary Hungary |
$247bn | · |
| 56 |  Qatar Qatar |
$221bn | · |
| 57 |  Ukraine Ukraine |
$213bn | · |
| 58 |  Morocco Morocco |
$183bn | · |
| 59 |  Kuwait Kuwait |
$158bn | · |
| 60 |  Slovakia Slovakia |
$154bn | · |
| 61 |  Uzbekistan Uzbekistan |
$147bn | · |
| 62 |  Angola Angola |
$142bn | · |
| 63 |  Kenya Kenya |
$136bn | · |
| 64 |  Bulgaria Bulgaria |
$131bn | · |
| 65 |  Ecuador Ecuador |
$130bn | · |
| 66 |  Dominican Republic Dominican Republic |
$128bn | · |
| 67 |  Guatemala Guatemala |
$121bn | · |
| 68 |  Ghana Ghana |
$115bn | · |
| 69 |  Ethiopia Ethiopia |
$109bn | · |
| 70 |  Oman Oman |
$106bn | · |
| 71 |  Croatia Croatia |
$106bn | · |
| 72 |  Costa Rica Costa Rica |
$103bn | · |
| 73 |  Luxembourg Luxembourg |
$101bn | · |
| 74 |  Serbia Serbia |
$100.0bn | · |
| 75 |  Venezuela Venezuela |
$99.7bn | · |
| 76 |  Côte d'Ivoire Côte d'Ivoire |
$98.9bn | · |
| 77 |  Lithuania Lithuania |
$94.9bn | · |
| 78 |  DR Congo DR Congo |
$92.8bn | · |
| 79 |  Belarus Belarus |
$92.8bn | · |
| 80 |  Panama Panama |
$90.5bn | · |
| 81 |  Tanzania Tanzania |
$87.3bn | · |
| 82 |  Uruguay Uruguay |
$85.6bn | · |
| 83 |  Myanmar Myanmar |
$82.4bn | · |
| 84 |  Slovenia Slovenia |
$79.6bn | · |
| 85 |  Turkmenistan Turkmenistan |
$77.4bn | · |
| 86 |  Azerbaijan Azerbaijan |
$75.9bn | · |
| 87 |  Uganda Uganda |
$66.0bn | · |
| 88 |  Bolivia Bolivia |
$64.3bn | · |
| 89 |  Jordan Jordan |
$61.7bn | · |
| 90 |  Cameroon Cameroon |
$59.3bn | · |
| 91 |  Tunisia Tunisia |
$57.6bn | · |
| 92 |  Zimbabwe Zimbabwe |
$53.5bn | · |
| 93 |  Paraguay Paraguay |
$49.4bn | · |
| 94 |  Cambodia Cambodia |
$49.3bn | · |
| 95 |  Latvia Latvia |
$48.6bn | · |
| 96 |  Bahrain Bahrain |
$47.5bn | · |
| 97 |  Estonia Estonia |
$47.0bn | · |
| 98 |  Nepal Nepal |
$44.8bn | · |
| 99 |  Libya Libya |
$44.7bn | · |
| 100 |  Cyprus Cyprus |
$41.0bn | · |
| 101 |  Sudan Sudan |
$39.7bn | · |
| 102 |  Honduras Honduras |
$39.7bn | · |
| 103 |  Iceland Iceland |
$38.6bn | · |
| 104 |  Georgia Georgia |
$38.2bn | · |
| 105 |  El Salvador El Salvador |
$37.3bn | · |
| 106 |  Senegal Senegal |
$37.1bn | · |
| 107 |  Lebanon Lebanon |
$34.5bn | · |
| 108 |  Bosnia and Herzegovina Bosnia and Herzegovina |
$33.0bn | · |
| 109 |  Papua New Guinea Papua New Guinea |
$32.5bn | · |
| 110 |  Haiti Haiti |
$32.1bn | · |
| 111 |  Albania Albania |
$30.3bn | · |
| 112 |  Mali Mali |
$30.1bn | · |
| 113 |  Armenia Armenia |
$29.2bn | · |
| 114 |  Zambia Zambia |
$28.9bn | · |
| 115 |  Malta Malta |
$27.8bn | · |
| 116 |  Guinea Guinea |
$27.2bn | · |
| 117 |  Burkina Faso Burkina Faso |
$27.1bn | · |
| 118 |  Guyana Guyana |
$27.1bn | · |
| 119 |  Trinidad and Tobago Trinidad and Tobago |
$25.9bn | · |
| 120 |  Mongolia Mongolia |
$25.4bn | · |
| 121 |  Benin Benin |
$24.4bn | · |
| 122 |  Mozambique Mozambique |
$22.3bn | · |
| 123 |  Jamaica Jamaica |
$22.3bn | · |
| 124 |  Nicaragua Nicaragua |
$22.2bn | · |
| 125 |  Chad Chad |
$22.1bn | · |
| 126 |  Niger Niger |
$21.8bn | · |
| 127 |  Gabon Gabon |
$21.6bn | · |
| 128 |  Kyrgyzstan Kyrgyzstan |
$21.6bn | · |
| 129 |  Moldova Moldova |
$20.3bn | · |
| 130 |  Afghanistan Afghanistan |
$19.7bn | · |
| 131 |  Madagascar Madagascar |
$19.6bn | · |
| 132 |  Botswana Botswana |
$19.5bn | · |
| 133 |  North Macedonia North Macedonia |
$19.1bn | · |
| 134 |  Laos Laos |
$17.8bn | · |
| 135 |  Tajikistan Tajikistan |
$17.5bn | · |
| 136 |  Bahamas Bahamas |
$16.5bn | · |
| 137 |  Mauritius Mauritius |
$16.1bn | · |
| 138 |  Rwanda Rwanda |
$16.0bn | · |
| 139 |  Brunei Brunei |
$15.9bn | · |
| 140 |  Republic of the Congo Republic of the Congo |
$15.6bn | · |
| 141 |  Malawi Malawi |
$15.0bn | · |
| 142 |  Namibia Namibia |
$14.8bn | · |
| 143 |  Somalia Somalia |
$13.0bn | · |
| 144 |  Equatorial Guinea Equatorial Guinea |
$12.5bn | · |
| 145 |  Kosovo Kosovo |
$12.4bn | · |
| 146 |  Mauritania Mauritania |
$12.3bn | · |
| 147 |  Togo Togo |
$11.9bn | · |
| 148 |  Montenegro Montenegro |
$9.2bn | · |
| 149 |  Liechtenstein Liechtenstein |
$9.0bn | · |
| 150 |  Barbados Barbados |
$8.0bn | · |
| 151 |  Yemen Yemen |
$7.9bn | · |
| 152 |  Sierra Leone Sierra Leone |
$7.7bn | · |
| 153 |  Maldives Maldives |
$7.7bn | · |
| 154 |  Burundi Burundi |
$6.9bn | · |
| 155 |  Fiji Fiji |
$6.0bn | · |
| 156 |  South Sudan South Sudan |
$5.7bn | · |
| 157 |  Liberia Liberia |
$5.2bn | · |
| 158 |  Eswatini Eswatini |
$5.2bn | · |
| 159 |  Suriname Suriname |
$4.7bn | · |
| 160 |  Andorra Andorra |
$4.5bn | · |
| 161 |  Djibouti Djibouti |
$4.4bn | · |
| 162 |  Bhutan Bhutan |
$3.5bn | · |
| 163 |  Belize Belize |
$3.3bn | · |
| 164 |  Central African Republic Central African Republic |
$3.2bn | · |
| 165 |  Cape Verde Cape Verde |
$3.1bn | · |
| 166 |  Lesotho Lesotho |
$2.9bn | · |
| 167 |  Saint Lucia Saint Lucia |
$2.7bn | · |
| 168 |  Guinea-Bissau Guinea-Bissau |
$2.6bn | · |
| 169 |  Gambia Gambia |
$2.6bn | · |
| 170 |  Seychelles Seychelles |
$2.3bn | · |
| 171 |  Antigua and Barbuda Antigua and Barbuda |
$2.3bn | · |
| 172 |  San Marino San Marino |
$2.3bn | · |
| 173 |  Timor-Leste Timor-Leste |
$2.1bn | · |
| 174 |  Solomon Islands Solomon Islands |
$1.7bn | · |
| 175 |  Comoros Comoros |
$1.6bn | · |
| 176 |  Grenada Grenada |
$1.4bn | · |
| 177 |  Vanuatu Vanuatu |
$1.3bn | · |
| 178 |  Samoa Samoa |
$1.3bn | · |
| 179 |  Saint Vincent and the Grenadines Saint Vincent and the Grenadines |
$1.2bn | · |
| 180 |  Saint Kitts and Nevis Saint Kitts and Nevis |
$1.1bn | · |
| 181 |  São Tomé and Príncipe São Tomé and Príncipe |
$981m | · |
| 182 |  Dominica Dominica |
$744m | · |
| 183 |  Tonga Tonga |
$680m | · |
| 184 |  Micronesia Micronesia |
$502m | · |
| 185 |  Kiribati Kiribati |
$349m | · |
| 186 |  Palau Palau |
$345m | · |
| 187 |  Marshall Islands Marshall Islands |
$308m | · |
| 188 |  Nauru Nauru |
$176m | · |
| 189 |  Tuvalu Tuvalu |
$58m | · |
| # | Country | 2050 forecast | GDP 2025 |
|---|---|---|---|
| 1 | China |
$41.9tn | $19.6tn |
| 2 | United States |
$37.2tn | $30.8tn |
| 3 | India |
$22.2tn | $3.92tn |
| 4 | Indonesia |
$6.30tn | $1.45tn |
| 5 | Germany |
$6.20tn | $5.05tn |
| 6 | Japan |
$6.00tn | $4.44tn |
| 7 | United Kingdom |
$5.20tn | $4.00tn |
| 8 | Brazil |
$4.90tn | $2.28tn |
| 9 | France |
$4.60tn | $3.37tn |
| 10 | Russia |
$4.50tn | $2.59tn |
| 11 | Mexico |
$4.20tn | $1.83tn |
| 12 | Saudi Arabia |
$3.50tn | $1.28tn |
| 13 | Egypt |
$3.50tn | $365bn |
| 14 | Canada |
$3.40tn | $2.32tn |
| 15 | Nigeria |
$3.40tn | $290bn |
Why they rank where they do
-
United States
The United States produces roughly the same share of world output as it did in 1980, about a quarter.
-
Germany
Germany's economy has barely grown since 2019. The cheap Russian gas that powered Germany's industrial model is gone, and Chinese electric vehicles now compete with Germany's car exports.
-
Russia
Russia's economy, measured in dollars, is about the size of Italy's. War production keeps official growth positive, but tanks and shells count toward GDP whether or not they leave anyone better off.
-
Taiwan
Taiwan makes about 90% of the world's most advanced computer chips, most of them at one company, TSMC. Many international tables leave Taiwan out because it lost its UN seat to Beijing in 1971, but the IMF includes it.
-
Ireland
American tech and pharmaceutical companies book global profits through Dublin for tax reasons, inflating Ireland's GDP so much that Irish statisticians publish an alternative measure roughly 40% smaller.
-
Nigeria
When Nigeria let the naira float in 2023, the currency lost roughly 70% of its value against the dollar. That roughly halved the dollar size of Nigeria's economy, even though Nigerians produced as much as before.
Will China's economy overtake the United States?
Measured by purchasing power, China already passed the United States in 2016 and is now about a third larger: $41.2 trillion against $30.8 trillion. At market exchange rates, the United States is still well ahead. Goldman Sachs projects that China will pass the United States at market exchange rates too, around 2035. By 2050 it expects China's economy to reach $41.9 trillion and America's $37.2 trillion, measured in 2021 dollars. The answer depends on which measure you use.
Which countries will have the largest economies in 2050?
Goldman Sachs projects that India will have the third largest economy by 2050, at $22.2 trillion, up from sixth place today. Indonesia is projected to rise to fourth, at $6.3 trillion, passing Germany, Japan and the United Kingdom. Germany falls to fifth at $6.2 trillion, Japan to sixth and the United Kingdom to seventh. Brazil is eighth. Goldman's forecasts are in 2021 dollars, which leaves out inflation, so they cannot be compared directly with today's figures in current dollars.
- United States$30.8tn
- China$19.6tn
- Germany$5.05tn
- Japan$4.44tn
- United Kingdom$4.00tn
- India$3.92tn
- France$3.37tn
- Russia$2.59tn
- China$41.9tn
- United States$37.2tn
- India$22.2tn
- Indonesia$6.30tn
- Germany$6.20tn
- Japan$6.00tn
- United Kingdom$5.20tn
- Brazil$4.90tn
Moves up the ranking
What is the difference between GDP and GDP at purchasing power?
GDP at market exchange rates converts each economy into dollars at the going rate. GDP at purchasing power adjusts for what money actually buys at home, so a haircut or a meal that costs fewer dollars counts for more. The gap can be large: India's economy is $3.9 trillion at market rates but $17.3 trillion at purchasing power, more than four times as much. For the United States, both figures are $30.8 trillion, because the measure is based on American prices.
How large is India's economy?
India's GDP was $3.9 trillion in 2025, making it the sixth largest economy. India was fifth in 2022 but slipped behind Japan and the United Kingdom after the rupee weakened and a 2026 revision of GDP statistics lowered the dollar total by about 4%. The IMF projects India will pass the United Kingdom again by 2027. By purchasing power, India's economy is $17.3 trillion.
Read more
-
 Blog
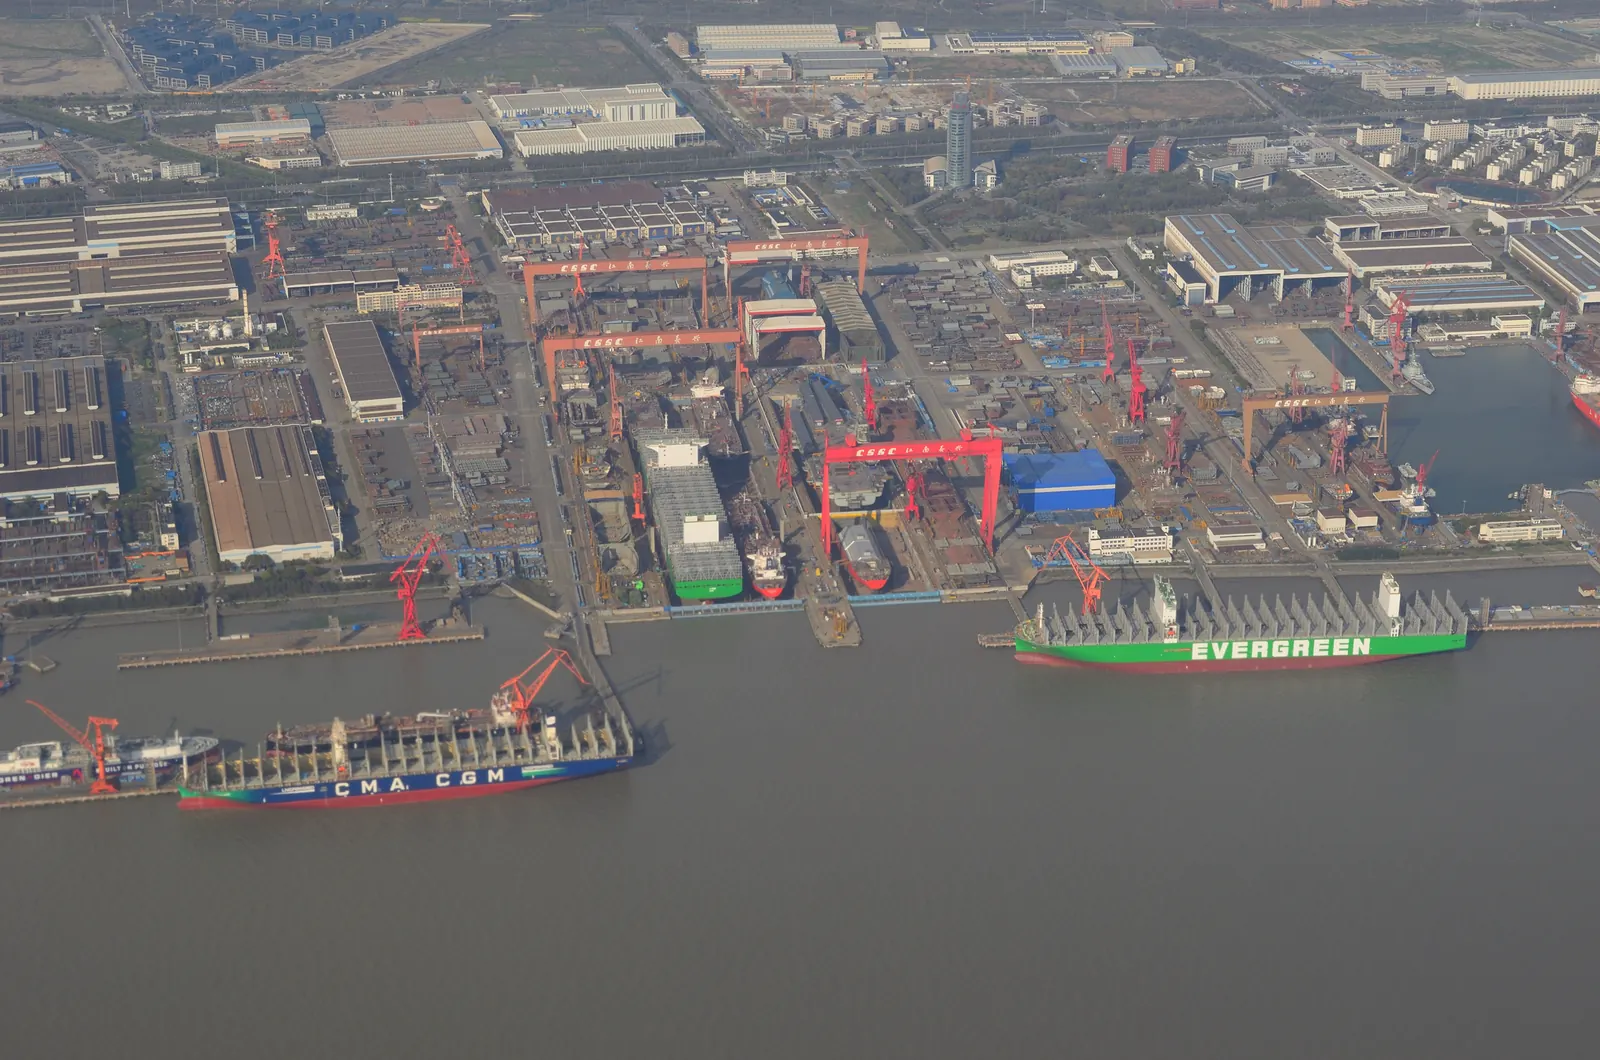
GDP vs PPP: is China's economy already bigger than America's?
China is both the world's largest economy and 11 trillion dollars behind the United States. What GDP and PPP measure, and which number to trust.
Blog
GDP vs PPP: is China's economy already bigger than America's?
China is both the world's largest economy and 11 trillion dollars behind the United States. What GDP and PPP measure, and which number to trust.
-
 Blog
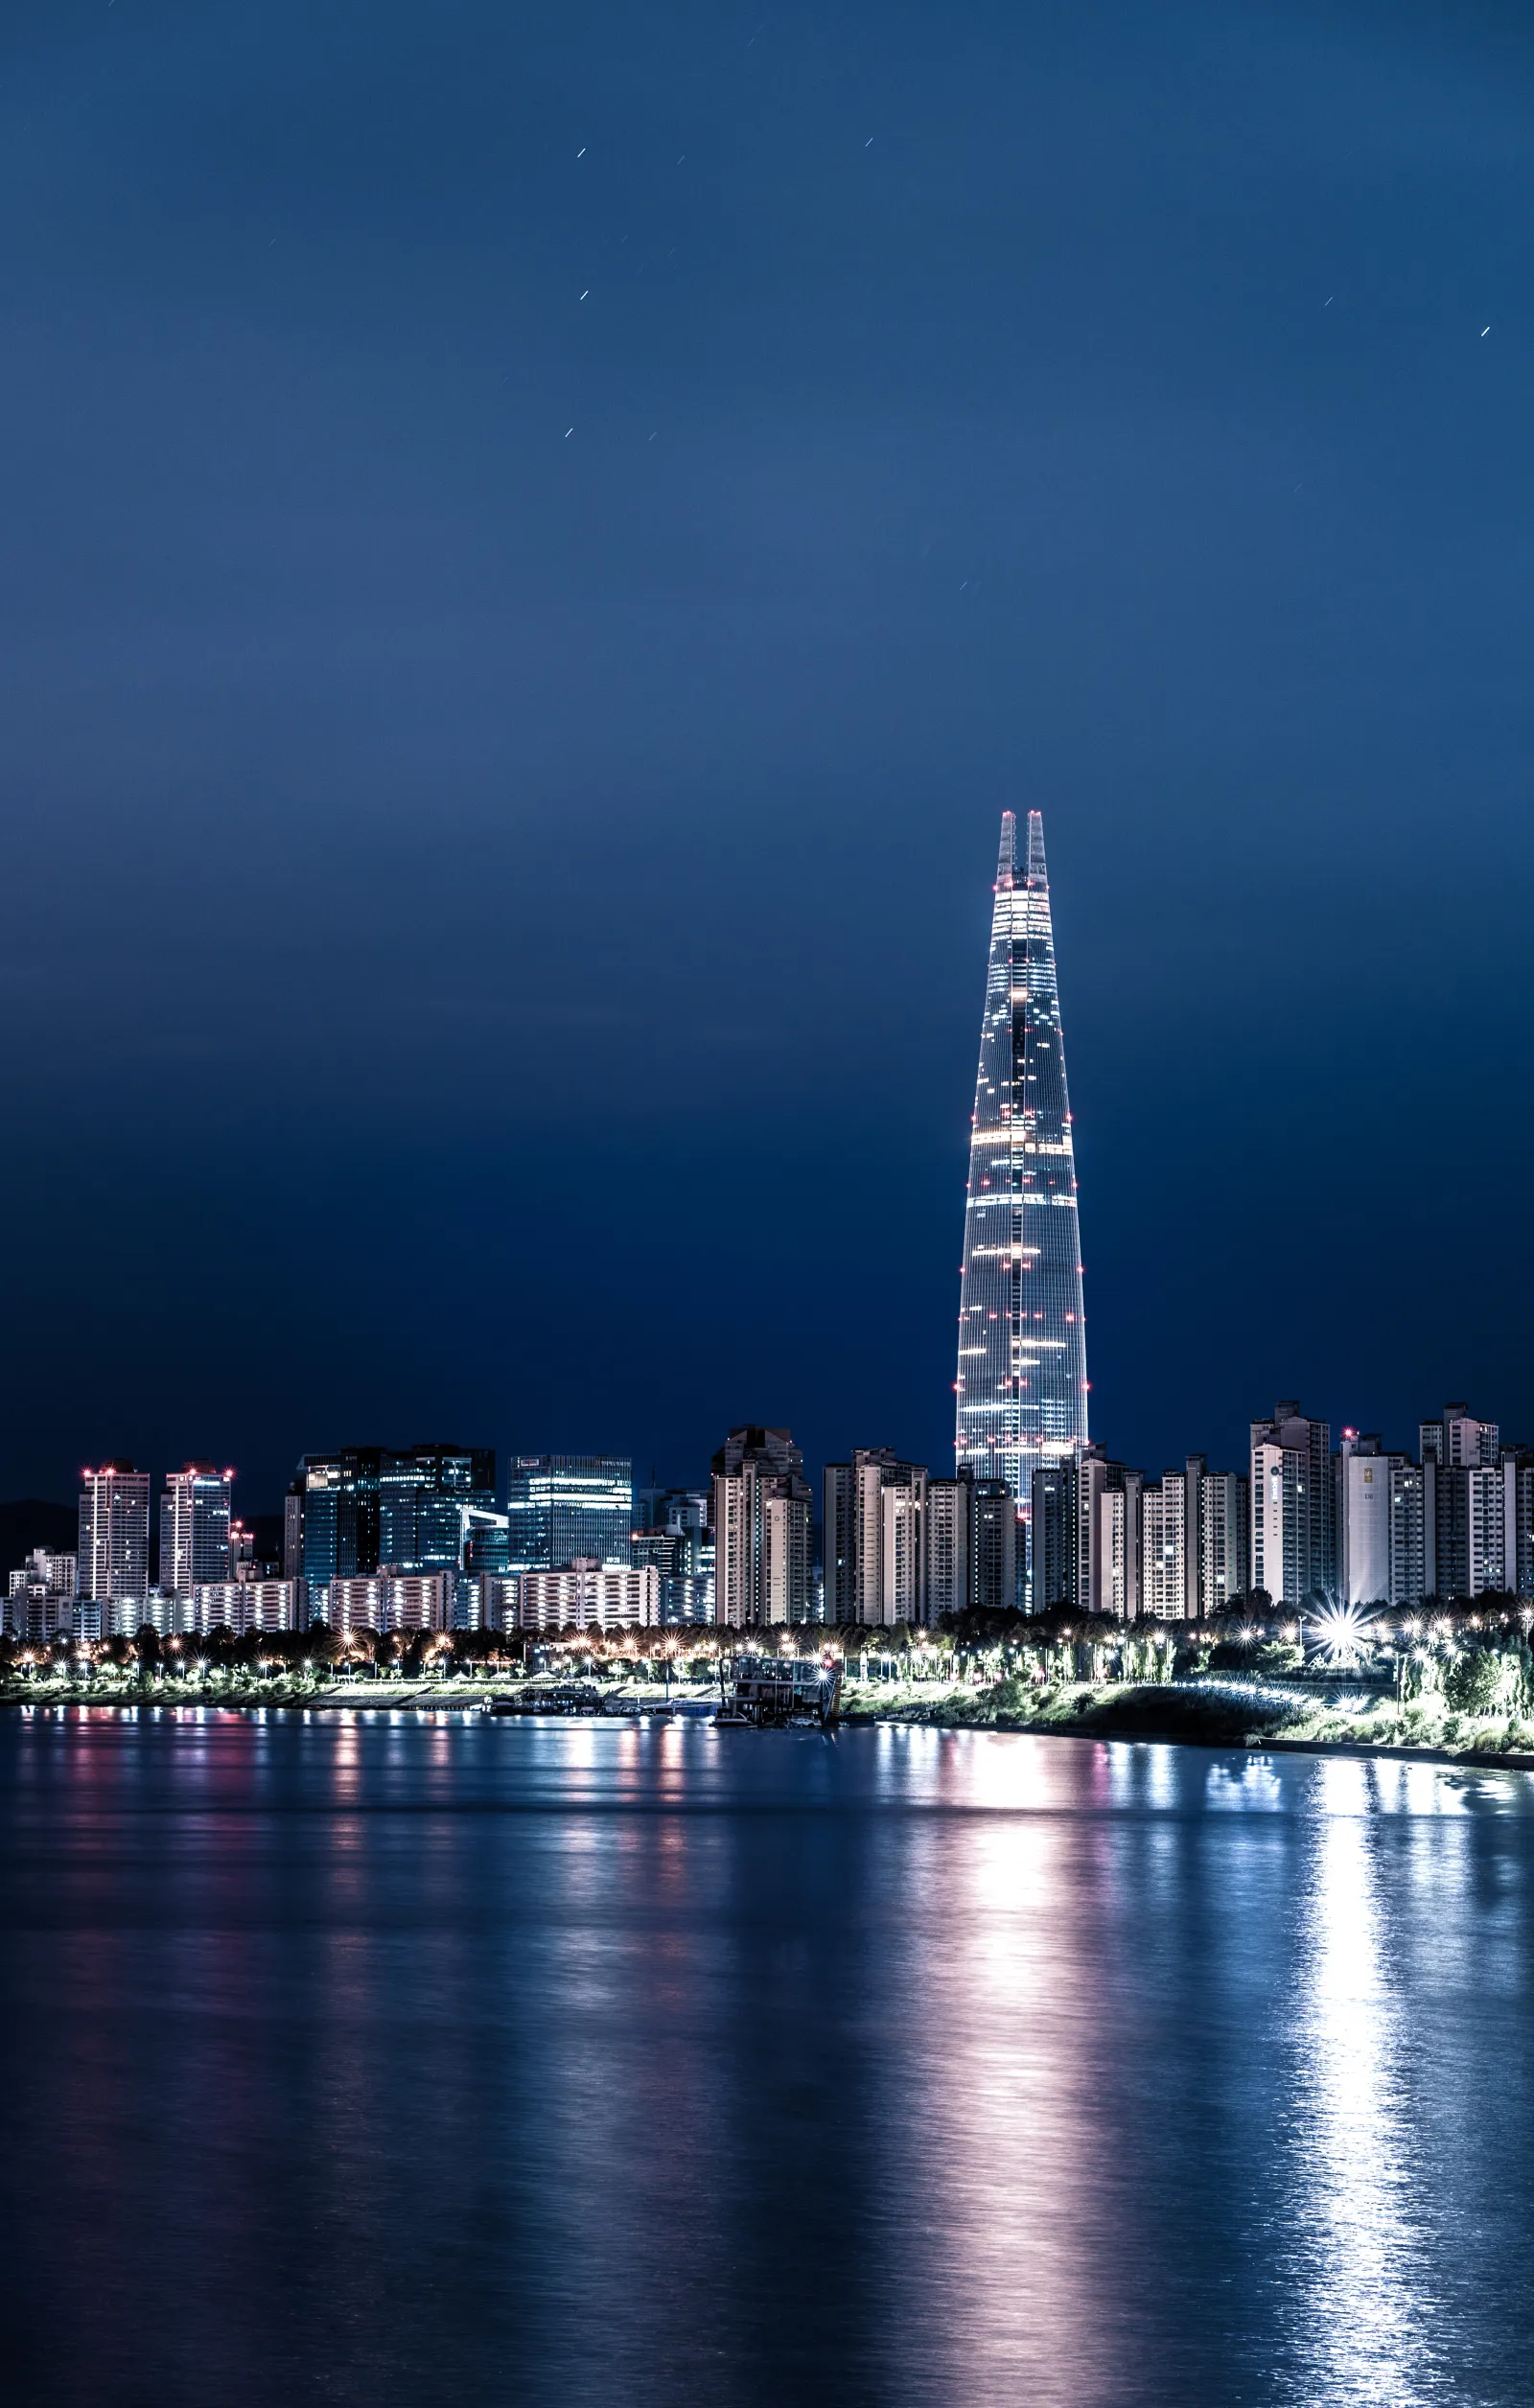
How South Korea went from poorer than Ghana to the world's 14th-largest economy
In 1960 South Korea's income per person was lower than Ghana's. One military dictator, Park Chung-hee, forced the country into steel, ships, and semiconductors in less than two decades.
Blog
How South Korea went from poorer than Ghana to the world's 14th-largest economy
In 1960 South Korea's income per person was lower than Ghana's. One military dictator, Park Chung-hee, forced the country into steel, ships, and semiconductors in less than two decades.