
Ranking · People
Fertility rate by country
By the UN's estimates, South Korea has the lowest fertility rate in the world, 0.75 children per woman in 2025. Taiwan's own count for 2025 was even lower, a record 0.695. Chad has the highest rate, 5.94. About 2.1 children per woman keeps a population stable, and 104 of the 196 countries are now below that level.
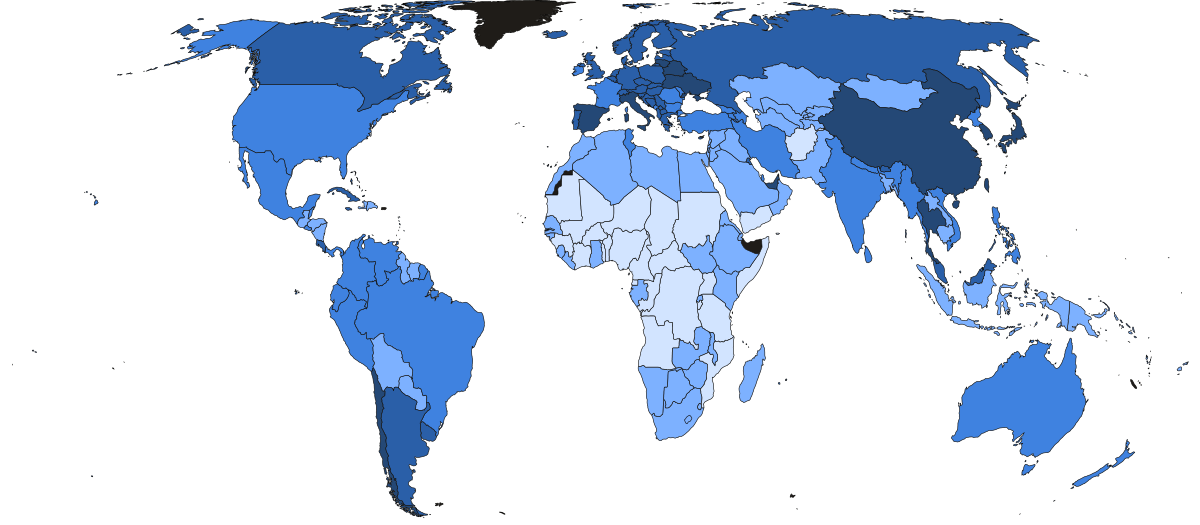
- Under 1.3
- 1.3–1.6
- 1.6–2.1
- 2.1–4
- Over 4
- Not in this ranking
- Under 1.3
- 1.3–1.6
- 1.6–2.1
- 2.1–4
- Over 4
- Not in this ranking
| # | Country | Children per woman | 1975 | Change since 1975 |
|---|---|---|---|---|
| 1 |  South Korea South Korea |
0.75 | 3.31 | −77% |
| 2 |  Taiwan Taiwan |
0.86 | 2.97 | −71% |
| 3 |  Singapore Singapore |
0.96 | 2.08 | −54% |
| 4 |  Ukraine Ukraine |
1.00 | 2.05 | −51% |
| 5 |  China China |
1.02 | 3.57 | −71% |
| 6 |  Andorra Andorra |
1.10 | 2.46 | −55% |
| 7 |  Malta Malta |
1.11 | 2.15 | −48% |
| 8 |  Chile Chile |
1.13 | 3.18 | −64% |
| 9 |  San Marino San Marino |
1.16 | 2.05 | −43% |
| 10 |  Thailand Thailand |
1.19 | 4.36 | −73% |
| 11 |  Mauritius Mauritius |
1.21 | 3.20 | −62% |
| 12 |  United Arab Emirates United Arab Emirates |
1.21 | 6.35 | −81% |
| 13 |  Italy Italy |
1.21 | 2.18 | −44% |
| 14 |  Belarus Belarus |
1.22 | 2.13 | −43% |
| 15 |  Lithuania Lithuania |
1.22 | 2.17 | −44% |
| 16 |  Japan Japan |
1.23 | 1.92 | −36% |
| 17 |  Spain Spain |
1.23 | 2.77 | −56% |
| 18 |  Finland Finland |
1.30 | 1.68 | −23% |
| 19 |  Poland Poland |
1.31 | 2.28 | −43% |
| 20 |  Costa Rica Costa Rica |
1.31 | 3.80 | −66% |
| 21 |  Albania Albania |
1.33 | 4.57 | −71% |
| 22 |  Austria Austria |
1.33 | 1.82 | −27% |
| 23 |  Canada Canada |
1.33 | 1.80 | −26% |
| 24 |  Greece Greece |
1.34 | 2.42 | −45% |
| 25 |  Jamaica Jamaica |
1.34 | 4.44 | −70% |
| 26 |  Latvia Latvia |
1.35 | 1.95 | −31% |
| 27 |  Bahamas Bahamas |
1.36 | 3.42 | −60% |
| 28 |  Cyprus Cyprus |
1.37 | 2.11 | −35% |
| 29 |  Estonia Estonia |
1.37 | 2.04 | −33% |
| 30 |  Saint Lucia Saint Lucia |
1.38 | 5.36 | −74% |
| 31 |  Belgium Belgium |
1.39 | 1.75 | −21% |
| 32 |  Uruguay Uruguay |
1.39 | 3.02 | −54% |
| 33 |  Luxembourg Luxembourg |
1.40 | 1.56 | −10% |
| 34 |  Norway Norway |
1.42 | 1.99 | −29% |
| 35 |  Bhutan Bhutan |
1.44 | 6.62 | −78% |
| 36 |  Sweden Sweden |
1.44 | 1.77 | −19% |
| 37 |  Netherlands Netherlands |
1.44 | 1.67 | −14% |
| 38 |  Switzerland Switzerland |
1.44 | 1.61 | −11% |
| 39 |  Cuba Cuba |
1.45 | 2.82 | −49% |
| 40 |  Russia Russia |
1.46 | 2.00 | −27% |
| 41 |  Germany Germany |
1.46 | 1.48 | −1% |
| 42 |  Grenada Grenada |
1.46 | 3.75 | −61% |
| 43 |  Czechia Czechia |
1.47 | 2.43 | −40% |
| 44 |  Croatia Croatia |
1.47 | 1.95 | −25% |
| 45 |  North Macedonia North Macedonia |
1.47 | 2.69 | −45% |
| 46 |  Dominica Dominica |
1.47 | 3.46 | −58% |
| 47 |  Cape Verde Cape Verde |
1.50 | 6.77 | −78% |
| 48 |  Kuwait Kuwait |
1.50 | 6.06 | −75% |
| 49 |  Hungary Hungary |
1.50 | 2.36 | −36% |
| 50 |  Iceland Iceland |
1.50 | 2.64 | −43% |
| 51 |  Bosnia and Herzegovina Bosnia and Herzegovina |
1.50 | 2.39 | −37% |
| 52 |  Serbia Serbia |
1.50 | 1.92 | −22% |
| 53 |  Argentina Argentina |
1.50 | 3.27 | −54% |
| 54 |  Saint Kitts and Nevis Saint Kitts and Nevis |
1.51 | 3.67 | −59% |
| 55 |  Denmark Denmark |
1.52 | 1.91 | −20% |
| 56 |  Portugal Portugal |
1.52 | 2.75 | −45% |
| 57 |  Trinidad and Tobago Trinidad and Tobago |
1.52 | 3.21 | −53% |
| 58 |  Malaysia Malaysia |
1.53 | 4.50 | −66% |
| 59 |  Kosovo Kosovo |
1.53 | 5.28 | −71% |
| 60 |  United Kingdom United Kingdom |
1.54 | 1.81 | −15% |
| 61 |  Liechtenstein Liechtenstein |
1.54 | 1.90 | −19% |
| 62 |  Maldives Maldives |
1.55 | 7.32 | −79% |
| 63 |  Slovakia Slovakia |
1.57 | 2.54 | −38% |
| 64 |  Slovenia Slovenia |
1.58 | 2.17 | −27% |
| 65 |  Antigua and Barbuda Antigua and Barbuda |
1.58 | 2.77 | −43% |
| 66 |  Ireland Ireland |
1.60 | 3.37 | −53% |
| 67 |  Brazil Brazil |
1.60 | 4.42 | −64% |
| 68 |  Turkey Turkey |
1.62 | 5.09 | −68% |
| 69 |  Colombia Colombia |
1.62 | 4.40 | −63% |
| 70 |  United States United States |
1.62 | 1.81 | −10% |
| 71 |  France France |
1.64 | 1.93 | −15% |
| 72 |  Australia Australia |
1.64 | 2.21 | −26% |
| 73 |  New Zealand New Zealand |
1.65 | 2.36 | −30% |
| 74 |  Azerbaijan Azerbaijan |
1.66 | 4.21 | −61% |
| 75 |  Iran Iran |
1.67 | 5.95 | −72% |
| 76 |  Qatar Qatar |
1.70 | 5.86 | −71% |
| 77 |  Barbados Barbados |
1.70 | 2.45 | −31% |
| 78 |  Brunei Brunei |
1.71 | 4.99 | −66% |
| 79 |  Armenia Armenia |
1.71 | 2.92 | −41% |
| 80 |  Romania Romania |
1.71 | 2.59 | −34% |
| 81 |  Moldova Moldova |
1.72 | 2.52 | −32% |
| 82 |  Bulgaria Bulgaria |
1.74 | 2.24 | −22% |
| 83 |  Saint Vincent and the Grenadines Saint Vincent and the Grenadines |
1.75 | 5.16 | −66% |
| 84 |  El Salvador El Salvador |
1.75 | 5.71 | −69% |
| 85 |  North Korea North Korea |
1.77 | 3.05 | −42% |
| 86 |  Bahrain Bahrain |
1.78 | 5.62 | −68% |
| 87 |  Georgia Georgia |
1.79 | 2.55 | −30% |
| 88 |  Ecuador Ecuador |
1.79 | 5.43 | −67% |
| 89 |  Tunisia Tunisia |
1.80 | 5.97 | −70% |
| 90 |  Montenegro Montenegro |
1.80 | 2.38 | −24% |
| 91 |  Palau Palau |
1.86 | 4.90 | −62% |
| 92 |  Mexico Mexico |
1.87 | 5.74 | −67% |
| 93 |  Philippines Philippines |
1.88 | 5.60 | −66% |
| 94 |  Vietnam Vietnam |
1.88 | 5.62 | −67% |
| 95 |  India India |
1.94 | 5.19 | −63% |
| 96 |  Nepal Nepal |
1.94 | 5.73 | −66% |
| 97 |  Sri Lanka Sri Lanka |
1.94 | 3.82 | −49% |
| 98 |  Peru Peru |
1.94 | 5.71 | −66% |
| 99 |  Belize Belize |
2.01 | 6.28 | −68% |
| 100 |  Venezuela Venezuela |
2.06 | 4.69 | −56% |
| 101 |  Seychelles Seychelles |
2.08 | 4.75 | −56% |
| 102 |  Myanmar Myanmar |
2.08 | 5.25 | −60% |
| 103 |  Monaco Monaco |
2.09 | 2.35 | −11% |
| 104 |  Panama Panama |
2.09 | 4.41 | −53% |
| 105 |  Indonesia Indonesia |
2.10 | 5.03 | −58% |
| 106 |  Bangladesh Bangladesh |
2.11 | 6.73 | −69% |
| 107 |  Morocco Morocco |
2.18 | 6.30 | −65% |
| 108 |  Nicaragua Nicaragua |
2.18 | 6.45 | −66% |
| 109 |  South Africa South Africa |
2.19 | 5.19 | −58% |
| 110 |  Dominican Republic Dominican Republic |
2.19 | 5.23 | −58% |
| 111 |  Lebanon Lebanon |
2.21 | 4.52 | −51% |
| 112 |  Suriname Suriname |
2.21 | 4.63 | −52% |
| 113 |  Libya Libya |
2.25 | 7.98 | −72% |
| 114 |  Fiji Fiji |
2.25 | 4.10 | −45% |
| 115 |  Guatemala Guatemala |
2.26 | 6.41 | −65% |
| 116 |  Saudi Arabia Saudi Arabia |
2.29 | 7.37 | −69% |
| 117 |  Laos Laos |
2.36 | 6.29 | −62% |
| 118 |  Guyana Guyana |
2.37 | 4.45 | −47% |
| 119 |  Paraguay Paraguay |
2.39 | 5.18 | −54% |
| 120 |  Honduras Honduras |
2.45 | 6.87 | −64% |
| 121 |  Oman Oman |
2.48 | 7.71 | −68% |
| 122 |  Bolivia Bolivia |
2.50 | 5.75 | −57% |
| 123 |  Cambodia Cambodia |
2.51 | 4.10 | −39% |
| 124 |  Timor-Leste Timor-Leste |
2.56 | 5.19 | −51% |
| 125 |  Jordan Jordan |
2.57 | 7.93 | −68% |
| 126 |  Djibouti Djibouti |
2.58 | 6.74 | −62% |
| 127 |  Mongolia Mongolia |
2.58 | 7.07 | −64% |
| 128 |  Haiti Haiti |
2.59 | 5.75 | −55% |
| 129 |  Turkmenistan Turkmenistan |
2.63 | 6.00 | −56% |
| 130 |  Lesotho Lesotho |
2.64 | 5.82 | −55% |
| 131 |  Botswana Botswana |
2.66 | 6.61 | −60% |
| 132 |  Syria Syria |
2.66 | 7.49 | −64% |
| 133 |  Algeria Algeria |
2.67 | 7.48 | −64% |
| 134 |  Eswatini Eswatini |
2.68 | 6.71 | −60% |
| 135 |  Egypt Egypt |
2.71 | 5.75 | −53% |
| 136 |  Micronesia Micronesia |
2.71 | 6.88 | −61% |
| 137 |  Kyrgyzstan Kyrgyzstan |
2.75 | 4.76 | −42% |
| 138 |  Israel Israel |
2.75 | 3.61 | −24% |
| 139 |  Marshall Islands Marshall Islands |
2.82 | 7.83 | −64% |
| 140 |  Kazakhstan Kazakhstan |
2.95 | 3.40 | −13% |
| 141 |  Tajikistan Tajikistan |
2.99 | 6.69 | −55% |
| 142 |  Papua New Guinea Papua New Guinea |
3.03 | 6.06 | −50% |
| 143 |  Tonga Tonga |
3.07 | 5.75 | −47% |
| 144 |  Kiribati Kiribati |
3.09 | 5.02 | −38% |
| 145 |  Kenya Kenya |
3.12 | 7.80 | −60% |
| 146 |  Tuvalu Tuvalu |
3.14 | 3.58 | −12% |
| 147 |  Namibia Namibia |
3.17 | 6.53 | −51% |
| 148 |  Iraq Iraq |
3.17 | 6.91 | −54% |
| 149 |  Palestine Palestine |
3.19 | 7.48 | −57% |
| 150 |  Nauru Nauru |
3.25 | 3.97 | −18% |
| 151 |  Ghana Ghana |
3.30 | 6.76 | −51% |
| 152 |  Uzbekistan Uzbekistan |
3.45 | 5.92 | −42% |
| 153 |  Solomon Islands Solomon Islands |
3.47 | 6.99 | −50% |
| 154 |  Pakistan Pakistan |
3.50 | 6.81 | −49% |
| 155 |  Malawi Malawi |
3.53 | 7.36 | −52% |
| 156 |  São Tomé and Príncipe São Tomé and Príncipe |
3.53 | 6.53 | −46% |
| 157 |  Vanuatu Vanuatu |
3.53 | 5.98 | −41% |
| 158 |  Gabon Gabon |
3.54 | 5.39 | −34% |
| 159 |  Rwanda Rwanda |
3.59 | 8.10 | −56% |
| 160 |  Eritrea Eritrea |
3.61 | 6.59 | −45% |
| 161 |  Sierra Leone Sierra Leone |
3.61 | 6.55 | −45% |
| 162 |  Zimbabwe Zimbabwe |
3.62 | 6.83 | −47% |
| 163 |  Guinea-Bissau Guinea-Bissau |
3.68 | 6.15 | −40% |
| 164 |  South Sudan South Sudan |
3.71 | 7.33 | −49% |
| 165 |  Senegal Senegal |
3.71 | 7.25 | −49% |
| 166 |  Samoa Samoa |
3.75 | 6.61 | −43% |
| 167 |  Comoros Comoros |
3.76 | 7.16 | −47% |
| 168 |  Liberia Liberia |
3.79 | 6.74 | −44% |
| 169 |  Gambia Gambia |
3.80 | 6.43 | −41% |
| 170 |  Ethiopia Ethiopia |
3.81 | 7.08 | −46% |
| 171 |  Madagascar Madagascar |
3.84 | 6.97 | −45% |
| 172 |  Zambia Zambia |
3.97 | 7.42 | −46% |
| 173 |  Burkina Faso Burkina Faso |
4.00 | 6.91 | −42% |
| 174 |  Equatorial Guinea Equatorial Guinea |
4.04 | 5.79 | −30% |
| 175 |  Guinea Guinea |
4.04 | 6.37 | −37% |
| 176 |  Republic of the Congo Republic of the Congo |
4.05 | 6.36 | −36% |
| 177 |  Uganda Uganda |
4.06 | 7.20 | −44% |
| 178 |  Togo Togo |
4.07 | 7.09 | −43% |
| 179 |  Côte d'Ivoire Côte d'Ivoire |
4.17 | 7.91 | −47% |
| 180 |  Cameroon Cameroon |
4.19 | 6.40 | −35% |
| 181 |  Sudan Sudan |
4.19 | 6.87 | −39% |
| 182 |  Nigeria Nigeria |
4.30 | 6.77 | −36% |
| 183 |  Yemen Yemen |
4.41 | 8.37 | −47% |
| 184 |  Benin Benin |
4.42 | 6.83 | −35% |
| 185 |  Tanzania Tanzania |
4.47 | 7.10 | −37% |
| 186 |  Mauritania Mauritania |
4.56 | 6.71 | −32% |
| 187 |  Mozambique Mozambique |
4.62 | 6.66 | −31% |
| 188 |  Afghanistan Afghanistan |
4.66 | 7.54 | −38% |
| 189 |  Burundi Burundi |
4.68 | 7.24 | −35% |
| 190 |  Angola Angola |
4.95 | 7.49 | −34% |
| 191 |  Mali Mali |
5.42 | 7.25 | −25% |
| 192 |  Niger Niger |
5.79 | 7.54 | −23% |
| 193 |  Central African Republic Central African Republic |
5.81 | 5.88 | −1% |
| 194 |  DR Congo DR Congo |
5.90 | 6.42 | −8% |
| 195 |  Somalia Somalia |
5.91 | 7.03 | −16% |
| 196 |  Chad Chad |
5.94 | 6.88 | −14% |
| # | Country | 1975 | Children per woman | Change since 1975 |
|---|---|---|---|---|
| 1 | Germany |
1.48 | 1.46 | −1% |
| 2 | Luxembourg |
1.56 | 1.40 | −10% |
| 3 | Switzerland |
1.61 | 1.44 | −11% |
| 4 | Netherlands |
1.67 | 1.44 | −14% |
| 5 | Finland |
1.68 | 1.30 | −23% |
| 6 | Belgium |
1.75 | 1.39 | −21% |
| 7 | Sweden |
1.77 | 1.44 | −19% |
| 8 | Canada |
1.80 | 1.33 | −26% |
| 9 | United Kingdom |
1.81 | 1.54 | −15% |
| 10 | United States |
1.81 | 1.62 | −10% |
| 11 | Austria |
1.82 | 1.33 | −27% |
| 12 | Liechtenstein |
1.90 | 1.54 | −19% |
| 13 | Denmark |
1.91 | 1.52 | −20% |
| 14 | Japan |
1.92 | 1.23 | −36% |
| 15 | Serbia |
1.92 | 1.50 | −22% |
| 16 | France |
1.93 | 1.64 | −15% |
| 17 | Latvia |
1.95 | 1.35 | −31% |
| 18 | Croatia |
1.95 | 1.47 | −25% |
| 19 | Norway |
1.99 | 1.42 | −29% |
| 20 | Russia |
2.00 | 1.46 | −27% |
| 21 | Estonia |
2.04 | 1.37 | −33% |
| 22 | Ukraine |
2.05 | 1.00 | −51% |
| 23 | San Marino |
2.05 | 1.16 | −43% |
| 24 | Singapore |
2.08 | 0.96 | −54% |
| 25 | Cyprus |
2.11 | 1.37 | −35% |
| 26 | Belarus |
2.13 | 1.22 | −43% |
| 27 | Malta |
2.15 | 1.11 | −48% |
| 28 | Lithuania |
2.17 | 1.22 | −44% |
| 29 | Slovenia |
2.17 | 1.58 | −27% |
| 30 | Italy |
2.18 | 1.21 | −44% |
| 31 | Australia |
2.21 | 1.64 | −26% |
| 32 | Bulgaria |
2.24 | 1.74 | −22% |
| 33 | Poland |
2.28 | 1.31 | −43% |
| 34 | Monaco |
2.35 | 2.09 | −11% |
| 35 | Hungary |
2.36 | 1.50 | −36% |
| 36 | New Zealand |
2.36 | 1.65 | −30% |
| 37 | Montenegro |
2.38 | 1.80 | −24% |
| 38 | Bosnia and Herzegovina |
2.39 | 1.50 | −37% |
| 39 | Greece |
2.42 | 1.34 | −45% |
| 40 | Czechia |
2.43 | 1.47 | −40% |
| 41 | Barbados |
2.45 | 1.70 | −31% |
| 42 | Andorra |
2.46 | 1.10 | −55% |
| 43 | Moldova |
2.52 | 1.72 | −32% |
| 44 | Slovakia |
2.54 | 1.57 | −38% |
| 45 | Georgia |
2.55 | 1.79 | −30% |
| 46 | Romania |
2.59 | 1.71 | −34% |
| 47 | Iceland |
2.64 | 1.50 | −43% |
| 48 | North Macedonia |
2.69 | 1.47 | −45% |
| 49 | Portugal |
2.75 | 1.52 | −45% |
| 50 | Spain |
2.77 | 1.23 | −56% |
| 51 | Antigua and Barbuda |
2.77 | 1.58 | −43% |
| 52 | Cuba |
2.82 | 1.45 | −49% |
| 53 | Armenia |
2.92 | 1.71 | −41% |
| 54 | Taiwan |
2.97 | 0.86 | −71% |
| 55 | Uruguay |
3.02 | 1.39 | −54% |
| 56 | North Korea |
3.05 | 1.77 | −42% |
| 57 | Chile |
3.18 | 1.13 | −64% |
| 58 | Mauritius |
3.20 | 1.21 | −62% |
| 59 | Trinidad and Tobago |
3.21 | 1.52 | −53% |
| 60 | Argentina |
3.27 | 1.50 | −54% |
| 61 | South Korea |
3.31 | 0.75 | −77% |
| 62 | Ireland |
3.37 | 1.60 | −53% |
| 63 | Kazakhstan |
3.40 | 2.95 | −13% |
| 64 | Bahamas |
3.42 | 1.36 | −60% |
| 65 | Dominica |
3.46 | 1.47 | −58% |
| 66 | China |
3.57 | 1.02 | −71% |
| 67 | Tuvalu |
3.58 | 3.14 | −12% |
| 68 | Israel |
3.61 | 2.75 | −24% |
| 69 | Saint Kitts and Nevis |
3.67 | 1.51 | −59% |
| 70 | Grenada |
3.75 | 1.46 | −61% |
| 71 | Costa Rica |
3.80 | 1.31 | −66% |
| 72 | Sri Lanka |
3.82 | 1.94 | −49% |
| 73 | Nauru |
3.97 | 3.25 | −18% |
| 74 | Fiji |
4.10 | 2.25 | −45% |
| 75 | Cambodia |
4.10 | 2.51 | −39% |
| 76 | Azerbaijan |
4.21 | 1.66 | −61% |
| 77 | Thailand |
4.36 | 1.19 | −73% |
| 78 | Colombia |
4.40 | 1.62 | −63% |
| 79 | Panama |
4.41 | 2.09 | −53% |
| 80 | Brazil |
4.42 | 1.60 | −64% |
| 81 | Jamaica |
4.44 | 1.34 | −70% |
| 82 | Guyana |
4.45 | 2.37 | −47% |
| 83 | Malaysia |
4.50 | 1.53 | −66% |
| 84 | Lebanon |
4.52 | 2.21 | −51% |
| 85 | Albania |
4.57 | 1.33 | −71% |
| 86 | Suriname |
4.63 | 2.21 | −52% |
| 87 | Venezuela |
4.69 | 2.06 | −56% |
| 88 | Seychelles |
4.75 | 2.08 | −56% |
| 89 | Kyrgyzstan |
4.76 | 2.75 | −42% |
| 90 | Palau |
4.90 | 1.86 | −62% |
| 91 | Brunei |
4.99 | 1.71 | −66% |
| 92 | Kiribati |
5.02 | 3.09 | −38% |
| 93 | Indonesia |
5.03 | 2.10 | −58% |
| 94 | Turkey |
5.09 | 1.62 | −68% |
| 95 | Saint Vincent and the Grenadines |
5.16 | 1.75 | −66% |
| 96 | Paraguay |
5.18 | 2.39 | −54% |
| 97 | India |
5.19 | 1.94 | −63% |
| 98 | South Africa |
5.19 | 2.19 | −58% |
| 99 | Timor-Leste |
5.19 | 2.56 | −51% |
| 100 | Dominican Republic |
5.23 | 2.19 | −58% |
| 101 | Myanmar |
5.25 | 2.08 | −60% |
| 102 | Kosovo |
5.28 | 1.53 | −71% |
| 103 | Saint Lucia |
5.36 | 1.38 | −74% |
| 104 | Gabon |
5.39 | 3.54 | −34% |
| 105 | Ecuador |
5.43 | 1.79 | −67% |
| 106 | Philippines |
5.60 | 1.88 | −66% |
| 107 | Bahrain |
5.62 | 1.78 | −68% |
| 108 | Vietnam |
5.62 | 1.88 | −67% |
| 109 | El Salvador |
5.71 | 1.75 | −69% |
| 110 | Peru |
5.71 | 1.94 | −66% |
| 111 | Nepal |
5.73 | 1.94 | −66% |
| 112 | Mexico |
5.74 | 1.87 | −67% |
| 113 | Bolivia |
5.75 | 2.50 | −57% |
| 114 | Haiti |
5.75 | 2.59 | −55% |
| 115 | Egypt |
5.75 | 2.71 | −53% |
| 116 | Tonga |
5.75 | 3.07 | −47% |
| 117 | Equatorial Guinea |
5.79 | 4.04 | −30% |
| 118 | Lesotho |
5.82 | 2.64 | −55% |
| 119 | Qatar |
5.86 | 1.70 | −71% |
| 120 | Central African Republic |
5.88 | 5.81 | −1% |
| 121 | Uzbekistan |
5.92 | 3.45 | −42% |
| 122 | Iran |
5.95 | 1.67 | −72% |
| 123 | Tunisia |
5.97 | 1.80 | −70% |
| 124 | Vanuatu |
5.98 | 3.53 | −41% |
| 125 | Turkmenistan |
6.00 | 2.63 | −56% |
| 126 | Kuwait |
6.06 | 1.50 | −75% |
| 127 | Papua New Guinea |
6.06 | 3.03 | −50% |
| 128 | Guinea-Bissau |
6.15 | 3.68 | −40% |
| 129 | Belize |
6.28 | 2.01 | −68% |
| 130 | Laos |
6.29 | 2.36 | −62% |
| 131 | Morocco |
6.30 | 2.18 | −65% |
| 132 | United Arab Emirates |
6.35 | 1.21 | −81% |
| 133 | Republic of the Congo |
6.36 | 4.05 | −36% |
| 134 | Guinea |
6.37 | 4.04 | −37% |
| 135 | Cameroon |
6.40 | 4.19 | −35% |
| 136 | Guatemala |
6.41 | 2.26 | −65% |
| 137 | DR Congo |
6.42 | 5.90 | −8% |
| 138 | Gambia |
6.43 | 3.80 | −41% |
| 139 | Nicaragua |
6.45 | 2.18 | −66% |
| 140 | Namibia |
6.53 | 3.17 | −51% |
| 141 | São Tomé and Príncipe |
6.53 | 3.53 | −46% |
| 142 | Sierra Leone |
6.55 | 3.61 | −45% |
| 143 | Eritrea |
6.59 | 3.61 | −45% |
| 144 | Botswana |
6.61 | 2.66 | −60% |
| 145 | Samoa |
6.61 | 3.75 | −43% |
| 146 | Bhutan |
6.62 | 1.44 | −78% |
| 147 | Mozambique |
6.66 | 4.62 | −31% |
| 148 | Tajikistan |
6.69 | 2.99 | −55% |
| 149 | Eswatini |
6.71 | 2.68 | −60% |
| 150 | Mauritania |
6.71 | 4.56 | −32% |
| 151 | Bangladesh |
6.73 | 2.11 | −69% |
| 152 | Djibouti |
6.74 | 2.58 | −62% |
| 153 | Liberia |
6.74 | 3.79 | −44% |
| 154 | Ghana |
6.76 | 3.30 | −51% |
| 155 | Cape Verde |
6.77 | 1.50 | −78% |
| 156 | Nigeria |
6.77 | 4.30 | −36% |
| 157 | Pakistan |
6.81 | 3.50 | −49% |
| 158 | Zimbabwe |
6.83 | 3.62 | −47% |
| 159 | Benin |
6.83 | 4.42 | −35% |
| 160 | Honduras |
6.87 | 2.45 | −64% |
| 161 | Sudan |
6.87 | 4.19 | −39% |
| 162 | Micronesia |
6.88 | 2.71 | −61% |
| 163 | Chad |
6.88 | 5.94 | −14% |
| 164 | Iraq |
6.91 | 3.17 | −54% |
| 165 | Burkina Faso |
6.91 | 4.00 | −42% |
| 166 | Madagascar |
6.97 | 3.84 | −45% |
| 167 | Solomon Islands |
6.99 | 3.47 | −50% |
| 168 | Somalia |
7.03 | 5.91 | −16% |
| 169 | Mongolia |
7.07 | 2.58 | −64% |
| 170 | Ethiopia |
7.08 | 3.81 | −46% |
| 171 | Togo |
7.09 | 4.07 | −43% |
| 172 | Tanzania |
7.10 | 4.47 | −37% |
| 173 | Comoros |
7.16 | 3.76 | −47% |
| 174 | Uganda |
7.20 | 4.06 | −44% |
| 175 | Burundi |
7.24 | 4.68 | −35% |
| 176 | Senegal |
7.25 | 3.71 | −49% |
| 177 | Mali |
7.25 | 5.42 | −25% |
| 178 | Maldives |
7.32 | 1.55 | −79% |
| 179 | South Sudan |
7.33 | 3.71 | −49% |
| 180 | Malawi |
7.36 | 3.53 | −52% |
| 181 | Saudi Arabia |
7.37 | 2.29 | −69% |
| 182 | Zambia |
7.42 | 3.97 | −46% |
| 183 | Algeria |
7.48 | 2.67 | −64% |
| 184 | Palestine |
7.48 | 3.19 | −57% |
| 185 | Syria |
7.49 | 2.66 | −64% |
| 186 | Angola |
7.49 | 4.95 | −34% |
| 187 | Afghanistan |
7.54 | 4.66 | −38% |
| 188 | Niger |
7.54 | 5.79 | −23% |
| 189 | Oman |
7.71 | 2.48 | −68% |
| 190 | Kenya |
7.80 | 3.12 | −60% |
| 191 | Marshall Islands |
7.83 | 2.82 | −64% |
| 192 | Côte d'Ivoire |
7.91 | 4.17 | −47% |
| 193 | Jordan |
7.93 | 2.57 | −68% |
| 194 | Libya |
7.98 | 2.25 | −72% |
| 195 | Rwanda |
8.10 | 3.59 | −56% |
| 196 | Yemen |
8.37 | 4.41 | −47% |
Why they rank where they do
-
South Korea
South Korea's own count rose to 0.80 in 2025, with 254,300 births. It was the second rise in a row, after a record low of 0.72 in 2023.
-
Taiwan
Births in Taiwan fell by a fifth in one year, from 134,856 in 2024 to 107,812 in 2025, the fewest on record.
-
Singapore
From 1972 Singapore's government campaigned for families to "Stop at Two". In 1987 it switched to "Have three or more, if you can afford it". Singapore's own count for 2025 was a record low of 0.87.
-
Ukraine
In the territory Ukraine's government controls, births fell from 273,770 in 2021 to 168,780 in 2025, and deaths were 2.9 times births in 2025. About 5.9 million refugees from Ukraine were abroad in February 2026.
-
China
China's one-child policy ran from 1980 to 2015. All couples could have two children from 2016 and three from 2021. Births still fell to 7.92 million in 2025, the fewest since 1949, and China's population fell for the fourth year in a row.
-
Japan
Japan recorded 671,236 births in 2025, the 10th record low in a row. Births first fell below 700,000 in 2024, for the first time since records began in 1899.
-
United States
The CDC recorded a record low fertility rate of about 1.60 in 2024. The United States keeps growing mainly through immigration.
-
France
In 2025 more people died in France than were born, 651,000 against 645,000, for the first time since 1945. France's own fertility rate fell to 1.56, the lowest since the end of World War I.
-
India
India fell below replacement level in its national health survey of 2019-21. The rate differs widely by state: official data for 2024 put Bihar at 2.9 and Kerala and Tamil Nadu at 1.3.
-
Israel
Israel has by far the highest fertility rate in the OECD, the club of rich countries: about 2.9 children per woman in Israel's own statistics, against an OECD average of 1.5. Haredi (ultra-Orthodox) Jewish women have about 6.5 children on average.
-
Niger
Niger had the world's highest fertility rate for many years. Its 2012 health survey found about 7.6 children per woman.
Which countries have the highest fertility rates?
The eight highest fertility rates are all in sub-Saharan Africa. Chad leads with 5.94 children per woman, just ahead of Somalia and DR Congo. These countries also have some of the youngest populations on Earth: the median age in 2024 was 15.4 in Niger, 15.6 in Mali and 15.7 in Chad.
Outside Africa, Afghanistan has the highest rate, 4.66, followed by Yemen at 4.41. Nigeria, Africa's most populous country, is at 4.30.
- Chad5.94
- Somalia5.91
- DR Congo5.90
- Central African Republic5.81
- Niger5.79
- Mali5.42
- Angola4.95
- Burundi4.68
Replacement level, 2.1 children per woman
What is the replacement fertility rate?
In countries with low death rates, about 2.1 children per woman keeps a population stable without migration. The number is above 2 because about 105 boys are born for every 100 girls, and because some girls die before they reach or finish their childbearing years. Where more children die young, the replacement level is higher.
In 1975, only 24 countries were below 2.1. In 2025, 104 of the 196 countries in this ranking are below it, and about 67% of the world's people live in them. The UN projects that the world's population will peak at about 10.3 billion in 2084.
Which countries' fertility rates have fallen the most?
Among countries with at least 20 million people, South Korea's fertility rate fell the most between 1975 and 2025, by 77%. Thailand, Iran, China and Taiwan each fell by more than 70%. Every one of the 196 countries in this ranking has a lower rate than in 1975.
Iran's fall was one of the fastest ever recorded. Iranian women had about 6.5 children in the mid-1980s. In December 1989 the government relaunched family planning, and the rate fell to about 2 by 2000. Then Iran's leaders changed course. In 2012 the government cut free contraception. In 2014 Supreme Leader Ali Khamenei made raising births official policy, and a 2021 law restricted contraception, sterilization and abortion.
- South Korea−77%
- Thailand−73%
- Iran−72%
- China−71%
- Taiwan−71%
- Saudi Arabia−69%
- Bangladesh−69%
- Turkey−68%
Change in children per woman, 1975 to 2025. Countries with at least 20 million people.
Can governments raise birth rates?
Some have tried, with little lasting success. South Korea's government spent about 380 trillion won from 2006 to 2023 on policies to raise births. South Korea's rate has risen two years in a row since 2023, but it is still one of the lowest in the world.
In Hungary, under Viktor Orbán, the rate rose from 1.23 in 2011 to 1.61 in 2021, then fell to 1.31 in 2025. Since 2020, Hungarian mothers of four or more children pay no income tax for life, and the exemption is being extended to mothers of three and two. In Georgia, the head of the Georgian Orthodox Church, Patriarch Ilia II, promised in 2007 to personally baptize every third and later child of married Orthodox parents. Births rose from about 49,000 in 2007 to about 63,000 in 2009. Georgia's rate peaked at 2.30 in 2014 and fell to 1.61 in 2025.